
Analysis of the Relationship between Privatization, Foreign Direct Investment, and Economic Growth in Azerbaijan
DOI:
https://doi.org/10.35945/gb.2024.17.007საკვანძო სიტყვები:
Privatization, Foreign Direct Investment, Economic Growth, FMOLS Test, CCR Testანოტაცია
The solution of the main problems of the innovative development of the national economy directly depends on the attractiveness of foreign investments. In this study, the relationship between privatization, foreign direct investment, and economic growth is examined. In the analysis part, fully modified Least squares (fmols) and canonical cointegrating regress (CCR) tests, which show the cointegration rate, causal relationship, and correlation, were applied for statistical data reflecting the annual time series between 1996-2021. According to the results of the study, according to the FMOLS test results, it was concluded that a 1 percent increase in GDP led to 1.924,866 percent in privatization, and a 1 percent change in privatization led to a 0.906129 percent change in GDP. It also found that a 1 percent increase in privatization led to a 0.080900 percent (0.1811919 percent per CCR) increase in foreign direct investment. According to the CCR test, a 1 percent change in foreign direct investment also led to a 0.893101 percent change in privatization.
Keywords: Privatization, Foreign Direct Investment, Economic Growth, FMOLS Test, CCR Test
Introduction
The addressed topic is mostly relevant in post-Soviet and other countries where the state owns a large share of the economy. Studying the results of this process, conducted at a high rate in the former Soviet countries about 30 years ago, may create opportunities for generating new ideas and hypotheses for both economic science and appropriate political decision-making.
The key goal of privatization, i.e., transforming state property into private one, is to save financial resources and create a ground for more fruitful activity. Privatization as a way to implement economic reforms is a condition for strengthening the market mechanisms in the economic system. It increases the efficiency of the economy and the state budget revenues, creates conditions for healthy competition, and reduces the state’s share and intervention in economic processes and the state’s burden in business modernization.
Privatization creates opportunities for expanding the operation of market mechanisms in economic regulation by strengthening the role of private property in the economic system. However, to ensure the desired outcome of this process, the country’s institutional environment should meet many conditions.
How does privatization affect the inflow of foreign direct investment in technologically backward countries rich in natural resources? Can it support economic growth in the country?
The choice of Azerbaijan’s economy as a research object to answer these questions is not accidental. One of the former Soviet republics, Azerbaijan, faced serious difficulties after gaining independence in 1991. The country commenced building a socially oriented market economy and started privatization. At that time, the country’s foreign economic relations, determined by the communist ideology, were destroyed, and various areas of the economy experienced a sharp crisis. Processing and agrarian sectors suffered the most from such a situation. Considering that state bodies had neither formed market institutions nor regulatory experience at that time, we can say that in Azerbaijan, privatization proceeded under unique conditions. The almost non-existent government bodies could not provide businesses with the required support. The economic consequences of privatization under such conditions are of particular interest.
In this context, the research objective analyzed the relationship between privatization, foreign direct investment, and economic growth in Azerbaijan.
Literature Overview
The analysis of privatization and economic growth shows contrasting and sharply diverging results. These differences may be caused by the techniques implemented and the databases used. However, considering the fundamental differences in the institutional and economic structures of countries in the models may also significantly affect the relationship between privatization and growth.
The analysis of the relationship between FDI and economic growth using data from 2003 to 2009 for 129 countries has shown that it is in all countries. However, FDI contributes more to low-income countries than high- and middle-income ones (Jawaid and Raza, 2012) [1].
Another study analyzed the impact of foreign direct investment, portfolio investment, and the 2008 global financial crisis on economic growth in developing countries and its sustainability and found that foreign direct investment increased economic growth in developing countries. This result approves the policy of developing countries to increase and stimulate foreign direct investment. Portfolio investment with short-term capital inflow in developing countries was not found to be associated with economic growth. The exchange rate and unemployment are other factors affecting economic growth in developing countries. The exchange rate negatively affects economic growth. The appreciation of the exchange rate and the depreciation of the national currency led to worsening expectations and uncertainty in the economy (Kuzucu, 2018) [2].
Indicators for 1996-2020 and the Granger causality test were used to study potential long-term relationships between foreign direct investment (FDI), economic growth, and employment in Azerbaijan. The empirical results showed a lack of causality between foreign direct investments and economic growth in the analyzed period. The causal relationship between foreign direct investment and employment has also not been established. This lack of causality can be attributed to the focus of direct investment in Azerbaijan, mainly on sectors such as finance, communications, and transport, which have limited opportunities for creating jobs. A lack of a significant relationship is, therefore, not surprising. (Guliyeva, 2023) [3].
A panel econometric assessment of the impact of foreign direct investment (FDI) on economic growth in 19 Latin American countries provides strong empirical evidence that it is not statistically significant in the aggregate. However, this result varies depending on the country’s development level. In highly developed countries, FDI positively and significantly impacts growth, while in upper-middle-income countries, it is uneven and insignificant. Finally, the impact is negative and statistically significant in lower-middle-income countries. Such results suggest that in Latin American countries, except for high-income ones, FDI is not an adequate mechanism to accelerate economic growth (Alvarado, Iñiguez, Ponce, 2017) [4].
The impact of foreign direct investment (FDI) on African economic growth was studied by processing panel data for 1980-2009 for 50 African countries. It has shown that FDI inflows significantly affected economic growth in Africa. However, this impact has changed throughout the period. It was also found that although the low level of human resources did not limit the impact of FDI on economic growth, it was negative between 1980 and 1994 and positive between 1995 and 2009 (Gui-Diby, 2014) [5].
The impact of FDI on economic growth was analyzed using a threshold regression model in the example of sub-Saharan African countries. The FDI inflow limit per capita was found to be approximately $44.67 per year. To have a significant FDI impact on economic growth, countries should have the minimum opportunity to assimilate the FDI benefits. E.g., the technology gap between foreign and domestic enterprises should be at least 0.6904. Thus, reaching the FDI threshold is required but insufficient for economic growth. Some countries use tax incentives to increase FDI inflows. It is argued that such incentives can be inefficient when low FDI inflows. Estimates of FDI coefficients below the minimum threshold are negative, meaning that the high costs of such incentives outweigh the potential benefits of FDI’s direct contribution to economic product and distribution (Asafo-Agyei and Kodongo, 2022) [6].
Empirical data on the relationship between foreign direct investment (FDI) and economic growth suggests a bidirectional causality. Processing data on FDI and economic growth for 1971-2010 for 124 countries shows positive and negative relationships between FDI and economic growth. The labour force, open trade, and economic freedom are the major determinants of the impact of FDI on economic growth (Iamsiraroj, 2016) [7].
Data for 1970-2019 and 2 estimation techniques (OLS and WLS) were used as part of the Cobb-Douglas production model to assess foreign direct investment’s impact on Albania’s economic development. The study results show that, except for employment, FDI does not affect Albania’s economic development, but when evaluated by the WLS technique, it has a direct positive effect on economic development. In striving for high economic development, Albania should increase its investments and create favourable conditions for attracting foreign direct investment to ensure long-term economic progress (Brahimi, 2022) [8].
Brief Description of Privatization and Foreign Direct Investment in Azerbaijan
In the early days after 1991, when the Republic of Azerbaijan declared its independence, the agricultural structures and processing industry facilities forming the starting point of the national economy were virtually state-owned. Under these conditions, transferring those enterprises to the private sector to stabilize, liberalize, and improve the economy has become important from the development standpoint.
In 1992, the institutional framework of privatization was created with the approval of the Charter of the State Property Committee. The development of the State Program for Privatizing State Property in the Republic of Azerbaijan in 1995-1998 accelerated these processes. Adopting the Presidential Decree On Approving Some Regulatory Documents for Privatizing State Property in 1996 documented the regulatory legal framework of privatizing state property.
In Azerbaijan, privatization started much later than in other post-Soviet countries. Privatization preparations in Azerbaijan can be divided into two important stages, namely, the arrangement and use of the conceptual-legal system. The period up to 1996 can be specified as a preparatory stage and considered the start of privatization. At this stage, along with creating the concept of privatization, the latter was performed in the transport, passenger carriage, trade, and catering sectors.
In the second privatization stage, by 2002, many large and medium businesses were privatized. In both stages, the key reason for privatization was to ensure the integration of the administrative framework into private ownership to accelerate the transition to a model economy. An army of entrepreneurs emerged during this period, irrespective of the property owner.
From the start of privatization to 01.01.2003, 36,869 small enterprises, facilities, and other equipment were privatized for a total value of AZN 110.0 mln (SSCAR, 2023) [9].
The inflow of additional funds in the state budget can be evaluated as a positive impact of privatization on the economy. Attracting foreign investors to privatize medium and large businesses was also important to ensure their sustainable, productive and developed activity.
Table 1 provides appropriate indicators of the distribution of privatized small state enterprises and facilities by years and sectors required for the analysis.
Table 1. Distribution of privatized small state enterprises and facilities by years and sectors
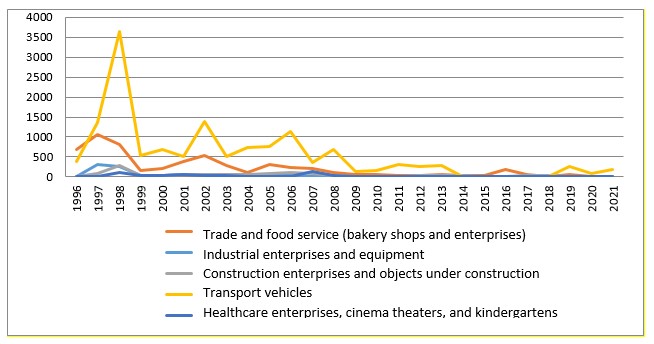
Source: State Service for Property Issues under the Ministry of Economy of the Republic of Azerbaijan [10]. https://emlak.gov.az/page/view/19
Foreign investment is also associated with using the country’s potential resources. When considering the available resources, we can see the need for long-term support from the regions that require speculation to improve production. In this regard, for local markets with great development prospects, the lack of technical innovations and the effective use of this potential are among the critical issues for promoting foreign investment in the country. On the other hand, attracting foreign investments is fruitful in terms of the impact on the country’s economy. Thus, the investment inflow mainly directed to the manufacture of products imported into the country will simultaneously improve the competitiveness, material well-being, employment, and the development of regional infrastructure in the country. Herewith, the attraction of direct foreign investment in the country’s economy to manufacture import-substituting products may reduce prices. Building a strong economy and decentralizing it will encourage the creation of relations with large regions in various fields. When attracting FDI to import-substituting products, the production components, innovative methods, efficiency, and generational similarity of the manufactured product should be considered. The Azerbaijan Export and Investment Promotion Foundation (AZPROMO), established in 2003, deals with attracting FDI. The key areas of AZPROMO’s activity are (https://azerbaijan.az/en/information/408): [11].
- Development of the country’s new image;
- Provision of diverse services to local and foreign investors;
- The attraction of investors and negotiating with them;
- Creation of a database on investment and export opportunities;
- Exploring the export potential of the Azerbaijani market in the area of regional trade;
- Provision of consultancy and marketing research services to export-oriented companies;
- Spreading the “Made in Azerbaijan” trademark internationally.
Statistical indicators of FDI in Azerbaijan for 1995-2021 are given in Table 2 (mln USD)
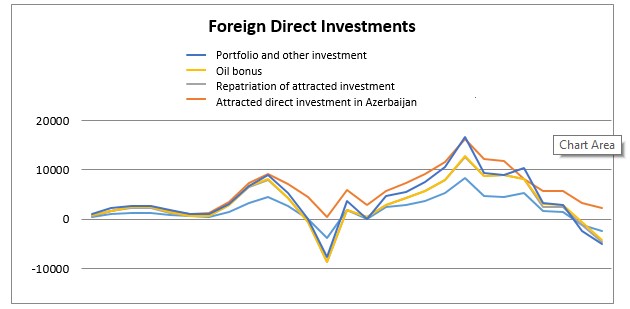
Source: State Statistics Committee of the Republic of Azerbaijan, https://www.stat.gov.az [9]
Several studies are devoted to the impact of other regulatory measures required to achieve the desired privatization results in Azerbaijan. Seyfullayev (2020 and 2022) [12], [13] obtained empirical data proving that the internal market protection and open trade policy are not satisfactory for the development of the country’s non-oil sector. The country’s current financial sector development level cannot give positive impulses for the processing industry development (Seyfullayev and Seyfullali, 2023) [14]. Despite positive relations found between some components of the state’s fiscal policy and the development of the non-oil sector, the benefits above were mainly manifested in non-commercial areas (Mammadov and Ahmadov, 2021 [15], Mukhtarov, S., Humbatova, S. and Seyfullayev, I. (2019) [16], Aliyev & Mikayilov, 2016 [17]).
DATA AND METHODS
Statistical data on privatization, FDI, and economic growth in Azerbaijan for 1996-2021 were used herein. The privatization, FDI, and economic growth (annual GDP growth) data used herein were obtained from, respectively, the State Property Committee of the Republic of Azerbaijan (SPCRA, 2023), the State Statistics Committee of the Republic of Azerbaijan (SSCAR, 2023), and the World Bank database (WB, 2023) [18]. The estimation model used herein is shown in the forms (1), (2), (3), (4), (5), and (6):
A regression model of the relationship between GDP, FDI, and privatization
(Khasanah, Ulfatun, Abdul Karim and Indah Manfaati Nur. “Pemodelan produk domestik regional bruto (pdrb) provinsı jawa tengah dengah pendekatan spasial autoregressive model panel data”. Prosiding seminar nasional and internasional.,2017) [19].
Yit = α + β1 Xit + εit,
Yit - dependent variableα - intersectionβ1 - independent variable slopeXit - independent (explanatory) variableεit - over (error)
Analyzing the Relationship between Privatization, FDI, and Economic Growth
analytical regression model.
GDPit = α + β1 PRIVit + εit (1),
PRIVit = α + β1 GDPit + εit (2),
PRIVit = α + β1 FDIit + εit (3),
FDIit = α + β1 PRIVit + εit (4),
GDPit = α + β1 FDIt + εit (5).
FDIit = α + β1 GDPit + εit (6)
Evaluation of econometric methods and results
Herein, the time series stationarity analysis was performed using the Augmented Dickey-Fuller (ADF) unit root test developed by Dickey and Fuller (Dickey & Fuller, 1981) [20]. The following formula was used in this analysis.
(3)
In this formula, ΔY is the 1st differential of the variable tested for stability, t is the common trend variable, and is the lagged difference terms. The reason for adding the lagged difference terms is to ensure sequential independence of the error terms. To obtain normal results from the ADF test, the estimated model should not have a sequential independence problem. The lag expressed as k in the formula is determined using the Akaike or Schwarz criteria. To perform the cointegration test, the sequences used should be stable, therefore, the unit root test was implemented. Thereby, the variable stability has been analyzed. Table 3 shows the unit root test results for the analyzed variables.
Table 3a. Unit Root Test Results (ADF)
|
At Level |
||||
|
|
|
PRIV |
FDI |
GDP |
|
With Constant |
t-Statistic |
-2.4822 |
-1.7745 |
-1.5360 |
|
|
Prob. |
0.1330 |
0.3833 |
0.4980 |
|
|
no |
no |
no |
|
|
With Constant & Trend |
t-Statistic |
-2.4612 |
-2.6772 |
-1.5697 |
|
|
Prob. |
0.3417 |
0.2543 |
0.7734 |
|
|
no |
no |
no |
|
|
Without Constant & Trend |
t-Statistic |
-1.1606 |
-0.2952 |
-0.4939 |
|
|
Prob. |
0.2170 |
0.5688 |
0.4910 |
|
|
no |
no |
no |
|
Graph 1. Unit Root Test Results Chart
Table 3b. Unit Root Test Results (ADF)
|
At First Difference |
||||
|
|
|
DPRIV |
DFDI |
DDGP |
|
With Constant |
t-Statistic |
-5.8535 |
-6.1006 |
-4.7745 |
|
|
Prob. |
0.0001 |
0.0000 |
0.0011 |
|
|
*** |
*** |
*** |
|
|
With Constant & Trend |
t-Statistic |
-5.7723 |
-5.9375 |
-4.6340 |
|
|
Prob. |
0.0006 |
0.0004 |
0.0067 |
|
|
*** |
*** |
*** |
|
|
Without Constant & Trend |
t-Statistic |
-6.9196 |
-6.2501 |
-4.9196 |
|
|
Prob. |
0.0000 |
0.0000 |
0.0000 |
|
|
*** |
*** |
*** |
|
Note: (*) Significant 10 percent; (**) Substantial 5 percent; (***) Means 1 percent significant and (none) Means not significant.
Graph 2. Unit Root Test Results Chart
Table 1a and Graph 1 show that the analyzed variables are unstable at a certain level. The sequences had to be stabilized by obtaining the first differential and solving the unit root problem. Table 1b and Graph 2 show that the obtained data are stable at the first differential and 1% significance level. For privatization, FDI, and economic growth sequences, the Dickey-Fuller test shows their stability at the first level since the probability equals 0, and the critical values are smaller than the respective ADF test results. After checking the stability of the analyzed sequences, a cointegration test should be performed to determine the availability of a long-term relationship. The cointegration test examines whether multiple variables are interrelated. If this test shows a cointegration (i.e., variables change together over a long term), the cause-and-effect relationship is confirmed. The cointegration test checks the relationship between two nonstable time series. Two or more time series can be considered cointegrated if their linear combinations are stable, even though they are nonstable themselves. Johansen Cointegration Test was developed to check the existence of a long-term relationship between variables. Table 4 provides the Cointegration Test results for the privatization and FDI series.
Table 4. Results of the Johansen Cointegration test on privatization and FDI.
|
Trace test |
Eigen Value statistics |
Trace statistics |
A critical value of 5 percent |
Probability |
|
None * |
0.779330 |
41.99815 |
15.49471 |
0.0000 |
|
At most 1 * |
0.386655 |
10.26537 |
3.841466 |
0.0014 |
|
Maximum Eigen Value Test |
Eigen Value statistics |
Max-Eigen statistics |
A critical value of 5 percent |
Probability |
|
None * |
0.779330 |
31.73278 |
14.26460 |
0.0000 |
|
At most 1 * |
0.386655 |
10.26537 |
3.841466 |
0.0014 |
Table 4 shows that there is a cointegration equality between the privatization and FDI variables at 1% significance levels for both Trace and Maximum Eigenvalues. This allows for drawing the conclusion that there is a long-term relationship between privatization and FDI.
Table 5 shows the Johansen Cointegration Test results for the privatization and economic growth series.
Cədvəl 5: Results of the Johansen Cointegration test on Privatization and GDP
|
Trace test |
Eigen Value statistics |
Trace statistics |
A critical value of 5 percent |
Probability |
|
None * |
0.481629 |
16.78238 |
15.49471 |
0.0318 |
|
At most 1 * |
0.132463 |
2.984043 |
3.841466 |
0.0841 |
|
Maximum Eigen Value Test |
Eigen Value statistics |
Max-Eigen statistics |
A critical value of 5 percent |
Probability |
|
None * |
0.481629 |
13.79833 |
14.26460 |
0.0591 |
|
At most 1 * |
0.132463 |
2.984043 |
3.841466 |
0.0841 |
Table 5 shows that there is a cointegration between privatization and economic growth variables at 5% and 10% levels for Trace values and at 10% level for Maximum Eigenvalue. These results allow for drawing the conclusion that there is a long-term relationship between privatization and economic growth.
Table 6 shows the Johansen Cointegration Test results for FDI and economic growth series.
Table 6: Results of the Johansen Cointegration test for FDI and GDP
|
Trace test |
Eigen Value statistics |
Trace statistics |
A critical value of 5 percent |
Probability |
|
None * |
0.468041 |
17.17237 |
15.49471 |
0.0277 |
|
At most 1 * |
0.138752 |
3.286195 |
3.841466 |
0.0699 |
|
Maximum Eigen Value Test |
Eigen Value statistics |
Max-Eigen statistics |
A critical value of 5 percent |
Probability |
|
None * |
0.468041 |
13.88617 |
14.26460 |
0.0573 |
|
At most 1 * |
0.138752 |
3.286195 |
3.841466 |
0.0699 |
Table 6 shows the cointegration relationship between FDI and economic growth at 1 percent and 10 percent significance levels for the tracking value and 10 percent for the Maximum Eigenvalue. According to this result, there seems to be a long-run relationship between FDI and economic growth. Estimates of long-run coefficients due to the cointegration relationship for the 6 models considered in the analysis are presented in Table 7 in the form of FMOLS and CCR test results.
Table 7. FMOLS and CCR test results
|
GDPit = α + β1 PRIVit + εit PRIVit = α + β1 GDPit + εit PRIVit = α + β1 FDIit + εit FDIit = α + β1 PRIVit + εit GDPit = α + β1 FDIit + εit FDIit = α + β1 GDPit + εit |
||||
|
Variables |
Coefficient |
Standard error |
t-statistic |
Probability value |
|
FMOLS GDP → PRIV |
1.924866 |
0.732670 |
2.627195 |
0.0157 |
|
FMOLS PRIV → GDP |
0.906129 |
0.386596 |
2.343866 |
0.0285 |
|
FMOLS PRIV → FDI |
0.080900 |
0.032300 |
2.504651 |
0.0206 |
|
FMOLS FDI → PRIV |
0.007561 |
0.096930 |
0.078005 |
0.9385 |
|
FMOLS GDP → FDI |
0.130425 |
0.077549 |
1.681840 |
0.1074 |
|
FMOLS FDI → GDP |
-0.049169 |
0.446229 |
-0.110188 |
0.9133 |
|
CCR GDP → PRIV |
1.839495 |
1.078867 |
1.705026 |
0.1029 |
|
CCR PRIV → GDP |
0.098310 |
0.057010 |
1.724442 |
0.0993 |
|
CCR PRIV → FDI |
0.181919 |
0.134410 |
1.353466 |
0.1903 |
|
CCR FDI → PRIV |
0.893101 |
0.438463 |
2.036893 |
0.0539 |
|
CCR GDP → FDI |
0.043941 |
0.655920 |
0.066991 |
0.9472 |
|
CCR FDI → GDP |
0.014582 |
0.103967 |
0.140254 |
0.8897 |
According to the FMOLS and CCR test results given in Figure 7, the positive privatization, foreign direct investment, and economic growth coefficients indicate a positive relationship between these variables. According to the FMOLS test, a 1% change in GDP causes a change in privatization by 1.924866% (an estimate according to CCR does not confirm the effect). Likewise, a 1% change in privatization leads to a 0.9061295% change in GDP (an estimate according to CCR does not confirm the effect).
According to the FMOLS test, a 1% change in privatization causes a 0.080900% change in FDI (an estimate according to CCR does not confirm the effect). However, for FDI, estimates according to FMOLS and CCR confirm the effect. The aforementioned FMOLS and CCR tests do not confirm the relationship between GDP and FDI.
Conclusion
This analysis examines the relationship between privatization, FDI, and economic growth. FMOLS and CCR tests providing cointegration, causality, and correlation coefficients were performed for the data’s annual time series for 1996-2021. According to the FMOLS test, a 1% change in GDP increases privatization by 1.92%, and a 1% change in privatization increases GDP by 0.9%. According to the FMOLS test, a 1% increase in privatization leads to a 0.08% growth in FDI.
The study shows that GDP growth has a greater impact on privatization, which, in turn, leads to greater market efficiency, and the demand for privatization rises with expanding economic growth. Although privatization has led to positive changes such as improved management, reduced bureaucracy, and increased market efficiency, it has a relatively slight impact on FDI inflows. Studying the impact of political stability, infrastructure development, market volume, and other regulatory instruments on attracting foreign investment in the country’s non-oil sector may create opportunities for obtaining more coherent arguments.
REFERENCES:
- Jawaid, Syed Tehseen and Raza, Syed Ali. (2012). Foreign Direct Investment, Growth and Convergence Hypothesis: A Cross Country Analysis. https://mpra.ub.uni-muenchen.de/39000/MPRA Paper No. 39000. [Last Access: 26.02.2024].
- Kuzucu, S. (2018). Do foreign direct investment and portfolio investment stimulate economic growth? Evidence from developing countries. Journal of Economics, Finance and Accounting (JEFA), V.5(4). p. 331-338.
- Shafa Guliyeva. (2023). The Relationship Between Foreign Direct Investments, Economic Growth And Employment, Vol 33, Mar 20.
- RafaelAlvarado, María Iñiguez, Pablo Ponce. (2017). Foreign direct investment and economic growth in Latin America, Economic Analysis and Policy Volume 56. pp. 176-187.
- Steve LorisGui-Diby. (2014).Impact of foreign direct investments on economic growth in Africa: Evidence from three decades of panel data analyses, Research in Economics Volume 68, Issue 3. pp. 248-256.
- George Asafo-Agyei, Odongo Kodongo. (2022). Foreign direct investment and economic growth in Sub-Saharan Africa: A nonlinear analysis, Economic Systems, Volume 46, Issue 4, 101003.
- SasiIamsiraroj. (2016).The foreign direct investment–economic growth nexus International Review of Economics & Finance Volume 42. pp. 116-133.
- FilloretaBrahimi. (2022).The role of Foreign Direct Investments in the Economic Development of Albania, IFAC-Papers OnLine Volume 55, Issue 39. pp. 399-403.
- SSCAR – State Statistic Comitee of Azerbaijan Republic, 2023. https://www.stat.gov.az [Last Access:02.2024].
- State Service for Property Issues under the Ministry of Economy of the Republic of Azerbaijan. https://emlak.gov.az/page/view/19 [Last Access:02.2024].
- Azerbaijan, General Informatıon. https://azerbaijan.az/en/information/408 [Last Access:02.2024].
- Seyfullayev, I. (2020). Protectionism and non-resource economic growth: Evidence from Azerbaijan. Problems and Perspectives in Management, 18(4). pp. 121- 129. http://dx.doi.org/10.21511/ppm.18(4).2020.11.
- Seyfullayev, I. (2022). Trade openness and economic growth: Evidence from Azerbaijan. Problems and Perspectives in Management, 20(1). pp.564-572. http://dx.doi.org/10.21511/ppm.20(1).2022.45.
- Seyfullayev, I., & Seyfullali, R. (2023). The impact of financial development on the manufacturing industry in resource-rich countries: Empirical evidence from Azerbaijan. Journal of Eastern European and Central Asian Research (JEECAR), 10(3). pp. 478–486. https://doi.org/10.15549/jeecar.v10i3.1289.
- Mammadov, I., Ahmadov F. (2021) Financial Development and Economic Growth: Evidence From Azerbaijan. WSEAS Transactions on Business and Economics, Volume 18, 2021. pp. 237-252 https://DOI:37394/23207.2021.18.25.
- Mukhtarov, S., Humbatova, S. and Seyfullayev, I. (2019). The impact of bank credits on non-oil GDP: evidence from Azerbaijan. Banks and Bank Systems, 14(2). pp. 120-127. doi:21511/bbs.14(2).2019.10.
- Aliyev, K., & Mikayilov, C. (2016). Does the Budget Expenditure Composition Matter for LongRun Economic Growth in a Resource Rich Country? Evidence from Azerbaijan, Academic Journal of Economic Studies, 2(2). pp. 147-168. researchgate.net/publication/304827952 [Last Access: 28.02.2024].
- The World Bank, https://data.worldbank.org/country/azerbaijan [Last Access:02.2024].
- Khasanah, Ulfatun, Abdul Karim and Indah Manfaati Nur. (2017). “Pemodelan produk domestik regional bruto (pdrb) provinsı jawa tengah dengah pendekatan spasial autoregressive model panel data”. Prosiding seminar nasional and internasional.
- Dickey & Fuller. (1981).
Downloads
ჩამოტვირთვები
გამოქვეყნებული
გამოცემა
სექცია
ლიცენზია
საავტორო უფლებები (c) 2024 Sevil Abdullayeva, Leyla Yusifova (Author)

ეს ნამუშევარი ლიცენზირებულია Creative Commons Attribution-ShareAlike 4.0 საერთაშორისო ლიცენზიით .
როგორ უნდა ციტირება
Share