
Forecasting the Economic Impacts of Renewable Energy Transition in Hydrocarbon-Exporting MENA Economies
DOI:
https://doi.org/10.35945/gb.2025.20.012Keywords:
Renewable energy transition, hydrocarbon-exporting MENA, structural VAR, scenario forecasting, economic diversificationAbstract
This study examines the macroeconomic implications of accelerating the renewable energy transition in hydrocarbon-exporting Middle East and North Africa (MENA) economies. Drawing on annual data from 2000 to 2024 for Saudi Arabia, the United Arab Emirates, Qatar, Kuwait, Algeria, and Oman, we estimate a panel structural vector autoregression (SVAR) that treats oil prices, global demand, and national renewable policy efforts as exogenous shocks. The model captures the dynamic interplay among non-oil GDP, government revenue, labor‑market outcomes, and renewable‑energy penetration. Impulse‑response analysis reveals that a positive renewable‑energy shock leads to sustained increases in non-oil GDP and modest reductions in unemployment, while fiscal dependence on hydrocarbons declines slightly. Scenario-based forecasts to 2035 show that countries with more ambitious renewable‑energy policies, such as the United Arab Emirates and Saudi Arabia, enjoy the largest absolute gains in non-oil GDP, whereas smaller economies still achieve meaningful proportional improvements. These findings underscore the potential of renewable investments to accelerate economic diversification and mitigate fiscal vulnerabilities. By incorporating a domestic policy index and forecasting alternative adoption paths, the study fills a gap in exporter-specific research and provides practical insights for policymakers seeking to balance growth with the energy transition.
Keywords: Renewable energy transition, hydrocarbon-exporting MENA, structural VAR, scenario forecasting, economic diversification.
- Introduction
The energy transition is reshaping macroeconomic prospects for fossil‑fuel exporters amid record global deployment of renewables and tightening climate goals. In 2024, renewable power capacity expanded by about 585 GW to reach roughly 4,448 GW worldwide, a 15% annual increase.[1] Despite this surge, current trajectories still fall short of the 2030 tripling target set in international fora, underscoring the urgency of accelerated action. Within this global picture, the Middle East added about 5 GW of new renewable capacity in 2023, signaling momentum but from a comparatively low base.[2] For hydrocarbon-exporting economies, multilateral analysis stresses mounting uncertainty over long-run fossil demand and associated fiscal and external risks, elevating the importance of diversification and resilience.
Saudi Arabia remains highly exposed to hydrocarbon cycles; oil rents measured about 24% of GDP in 2021, yet it has accelerated tenders and set ambitions toward large-scale renewables by 2030.[3] The United Arab Emirates exhibits a large non-oil base (non-oil GDP near 77% in 2025 forecasts) while its flagship firm, Masdar, targets 100 GW of wind and solar by 2030,[4] positioning the country as a regional renewables leader. Qatar’s fiscal and external surpluses narrowed with lower hydrocarbon prices in 2023, yet LNG expansion underpins a still‑positive medium-term outlook.[5] Kuwait’s hydrocarbons account for roughly 70% of government revenue and about 80% of exports, reflecting deep fiscal sensitivity to oil prices.[6] Algeria’s hydrocarbons have supplied about two-thirds of budget revenue since 2020,[7] while Oman remains heavily reliant on 85% of public income from oil and gas, prompting tax reform to broaden the base (Maashani et al., 2025).[8]
Existing empirical Kahia et al. (2019),[9] Mebrek et al. (2024),[10] Michailidis et al. (2025),[11] Satari Yuzbashkandi et al. (2024)[12] work on MENA often employs panel VARs linking renewable energy, growth, and emissions, but typically centers on net oil importers or broader regional samples with limited exporter-specific analysis. Parallel strands assess oil‑price shocks and macro-outcomes, or fiscal multipliers, yet seldom incorporate explicit renewable penetration metrics within a structural identification for exporters. Cross-country studies suggest renewables can hedge growth against oil‑price volatility, but country‑and‑policy-specific mechanisms remain underexplored for hydrocarbon-exporting MENA economies. Moreover, forward-looking, scenario-consistent forecasts to the mid-2030s are scarce for this subset, particularly those integrating exogenous oil shocks and domestic policy trajectories. Evidence, therefore, reveals a gap at the intersection of renewable adoption, fiscal vulnerability, and macro‑forecasting in exporter contexts.
This study addresses the gap by estimating a panel structural VAR with exogenous oil‑price and global‑demand shocks and an explicit domestic renewable‑policy index, enabling causal interpretation and scenario-based projections. The framework recovers impulse responses and variance decompositions while producing conditional forecasts under alternative renewable‑adoption paths. Hypothesis 1 posits that increases in renewable investment and penetration exert a positive and statistically significant effect on long-run GDP growth in hydrocarbon-exporting MENA economies. Hypothesis 2 posits that higher renewable shares reduce fiscal vulnerability to oil‑price volatility, observable as lower revenue elasticity and variance to oil shocks. The empirical assessment covers Saudi Arabia, the United Arab Emirates, Qatar, Kuwait, Algeria, and Oman from 2000-2024 with projections to 2035.
The study is important for macroeconomic planning in hydrocarbon-dependent economies facing structural energy market shifts and demanding fiscal agendas. The objective is to quantify the growth and fiscal consequences of renewable deployment using structural identification rather than simple correlations. Scenario‑consistent forecasts aim to inform budgeting, debt sustainability, and diversification strategies under heterogeneous policy and price paths. Additional goals include benchmarking country-specific outcomes across the six exporters and gauging the magnitude of fiscal‑risk mitigation attributable to renewables. The resulting evidence seeks to support credible transition pathways aligned with national strategies and international commitments.
The model includes non-oil GDP, revenue ratios, labor metrics, and renewable share, with oil prices, world GDP, and policy index as exogenous. Data (2000–2024) come from the World Bank, IMF, IRENA, and OPEC, with standard transformations. Sign restrictions identify oil and renewable shocks; lag length is data-driven. Forecasts run to 2035 under scenarios; robustness uses local projections and policy index tests (IRENA).
The paper sets context, reviews literature, defines data and methodology, and then estimates a panel SVAR. It ends with results, policy implications, and future research directions.
- Literature Review
Over the past few decades, the global energy landscape has undergone a fundamental transformation, driven by escalating environmental challenges and the economic vulnerabilities associated with fossil fuel dependence.[13] This transition has prompted a growing body of academic research aimed at examining the dynamic relationship between energy consumption, particularly renewable energy sources, and economic growth. Special attention has been devoted to resource-abundant regions such as the Middle East and North Africa (MENA), where the imperative to diversify energy portfolios intersects with broader sustainability and development goals.
Poudineh et al. (2018)[14] argue that investing in renewable energy is a “no‑regret” strategy for hydrocarbon-exporting MENA economies. They highlight that reforms such as removing fossil‑fuel subsidies and establishing stable regulatory frameworks are crucial for promoting renewables. The study emphasizes electricity market design, robust institutions, and risk‑mitigation measures to attract investment. While not quantitative, the analysis situates renewable‑energy policies within broader energy‑sector reforms and underscores the importance of aligning policies with national development strategies.
Kahia et al. (2019)[15] used second-generation panel data techniques on the ten countries with the highest renewable‑energy consumption, addressing cross-sectional dependence and heterogeneity. After confirming unit roots and cointegration via CADF and Westerlund tests, the authors employ Common Correlated Effects (CCE) and Augmented Mean Group (AMG) estimators. They find that renewable‑energy consumption has a positive and significant long-run effect on economic growth, while fossil‑fuel consumption also positively influences growth; however, primary renewable‑energy production exhibits a negative effect, suggesting technological inefficiencies. The study underscores the need for aligning energy policies with sustainability objectives.
Kouyakhi (2022)[16] analyses six Arab countries using a Panel ARDL framework with Mean Group (MG) and Pooled Mean Group (PMG) estimators. The analysis confirms a long-run cointegrated equilibrium among renewable‑energy consumption, real GDP, and CO₂ emissions. Long-run MG estimates indicate that renewable‑energy consumption significantly reduces CO₂ emissions (coefficient ≈ −0.13), while economic growth increases emissions (coefficient ≈ 0.84). Short-run coefficients are mostly insignificant, and a Hausman test favors the MG estimator, implying heterogeneity across countries. The authors conclude that policymakers should accelerate the adoption of green technologies to mitigate emissions and decouple growth from environmental degradation.
Using panel data for Algeria, Egypt, Iraq, the UAE, Qatar, and Saudi Arabia, Dırır (2023)[17] employs a Panel ARDL model and Dumitrescu-Hurlin causality tests to identify factors influencing renewable‑energy consumption. The model relates renewable consumption to energy imports, national income, inflation, government spending, economic growth, trade, and manufacturing value‑added. Long-run estimates show that energy imports and national income reduce renewable‑energy use, whereas inflation, government expenditure, economic growth, and industrial performance increase it. Causality tests reveal unidirectional causality from energy imports, national income, economic growth, trade and industrial performance to renewable‑energy consumption, but not vice‑versa.
Alofaysan (2024)[18] examines eight MENA countries using a non-parametric panel quantile ARDL (Q‑ARDL) and PMG‑ARDL approach. It finds that increases in green innovation and renewable‑energy consumption reduce the carbon footprint at different quantiles and that these effects strengthen over time. PMG‑ARDL results confirm that renewable energy and green innovation protect ecological quality in the long run, whereas economic growth tends to increase environmental degradation; short-run effects are weaker. Policy recommendations stress the importance of supportive regulatory frameworks, R&D investment, and workforce training to harness long-term benefits.
Matallah (2024)[19] discusses how AI can enhance forecasting, optimize storage, and support smart grid operations in MENA. Citing recent studies, it notes that AI-based forecasting methods can reduce prediction errors in solar and wind output by up to 30%, improving grid balancing. The MENA AI‑in‑energy market was valued at roughly US$54.48 million in 2024 with a projected CAGR of 22.24% through 2033. The article argues that successful AI deployment could reduce dependence on oil revenues, attract clean‑technology investment, and bolster energy security, but challenges such as data scarcity, regulatory gaps, and potential inequalities must be addressed. Policy pathways include pilot AI projects, investment in data infrastructure, “green AI” strategies, regulatory reforms, and regional cooperation.
Unlike earlier research, our study estimates a panel SVAR-X model for six hydrocarbon exporters, incorporating exogenous oil shocks and a newly constructed domestic renewable policy index. This enables causal interpretation of renewable energy’s impact on diversification and fiscal vulnerability. By offering scenario-based forecasts to 2035 under varying policy ambitions, our study fills a critical gap and provides actionable insights for exporter-specific transition strategies.
- Methodology
The panel SVAR framework models each country’s macroeconomic variables as functions of their own lags, the lags of other countries, and exogenous shocks. Identification uses sign restrictions consistent with theory: a positive oil‑price shock is assumed to raise government revenue on impact, while a positive renewable‑energy shock increases the renewable share without contemporaneously affecting oil prices. This approach avoids some of the identification problems inherent in traditional simultaneous equation models by focusing on shocks. Lag lengths are chosen using information criteria, with cross-sectional dependence tests ensuring robustness. Outputs include impulse‑response functions, forecast‑error variance decompositions, and scenario-based forecasts to 2035, validated through 2015–2024 back‑testing.
3.1. Data and variables
Annual data for 2000–2024 are compiled for Saudi Arabia, the UAE, Qatar, Kuwait, Algeria, and Oman. Sources include the World Bank’s World Development Indicators (WDI), IMF Government Finance Statistics (GFS) and World Economic Outlook (WEO), IRENA/IEA renewables statistics, OPEC/EIA oil‑price data, and national policy documents. Variables and their characteristics are summarized in Table 1.
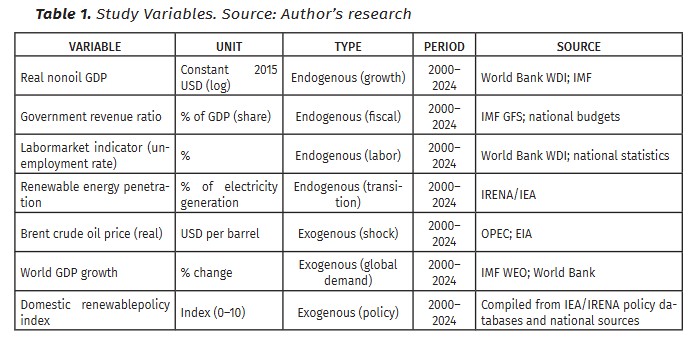
The choice of real non-oil GDP reflects the need to measure economic activity beyond the hydrocarbon sector and assess whether renewable investments stimulate broader growth. Government revenue as a share of GDP is included because oil revenues accrue mainly to governments, and fiscal policy choices in oil-centered economies significantly influence macroeconomic performance. A labor‑market indicator captures employment and social impacts of the transition, acknowledging that macroeconomic shocks affect labor outcomes. Renewable penetration (share of electricity generation or capacity) is the key policy variable, indicating the progress of the energy transition; higher renewable shares may hedge growth against oil‑price volatility. Brent oil prices enter exogenously as the principal external shock affecting hydrocarbon exporters, while world GDP growth proxies global demand conditions. Finally, a domestic renewable‑policy index constructed from the timing and stringency of renewable targets, auctions, and incentives captures national policy efforts to drive the transition.
- Results and Discussion
- Descriptive statistics and trends
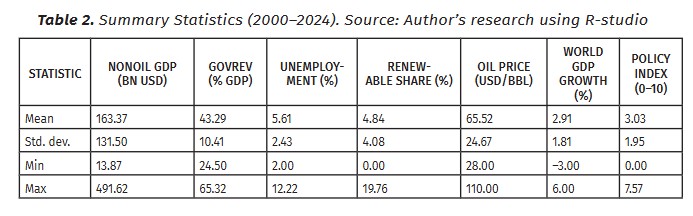
The non-oil GDP averages $163.4 billion but varies significantly across countries (std. dev. ≈ 131.5), reflecting differences in economic size and diversification. Government revenue ratios range between 24% and 65%, indicating varying degrees of dependence on hydrocarbon income. Unemployment rates span from 2% to 12%, while renewable energy shares range from 0% to 19.76%, and policy indices from 0 to 7.57—highlighting stark differences in labor market dynamics, energy transition progress, and policy ambition, as shown in Table 2.
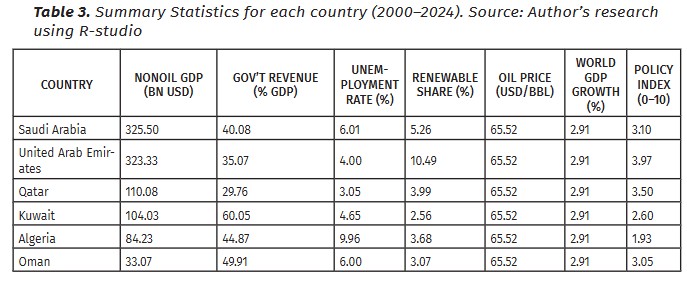
According to the comparative forecast data in Table 3, Saudi Arabia and the UAE exhibit the most substantial non-oil economic scales, both averaging near $325 billion, while Oman’s output remains modest at around $33 billion. Kuwait maintains the highest fiscal reliance on hydrocarbons, with government revenues constituting 60% of GDP, in stark contrast to Qatar’s 29.8%. The UAE demonstrates clear leadership in renewable energy adoption, reaching a 10.5% share, while Kuwait trails significantly. Similarly, the UAE’s top position on the policy index reflects its structured and aggressive commitment to the energy transition.
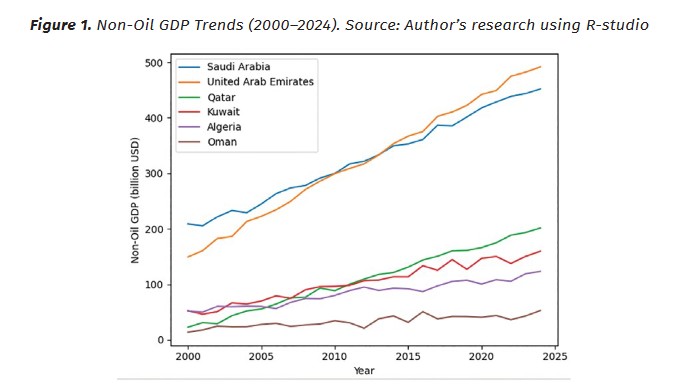
The non-oil GDP of all six hydrocarbon exporters has risen substantially since 2000.
The United Arab Emirates and Saudi Arabia show the most pronounced growth, ending 2024 above US$490 bn and US$450 bn, respectively. Qatar climbs steadily from about US$22 bn to around US$200 bn, while Kuwait, Algeria, and Oman remain smaller but trend upward.
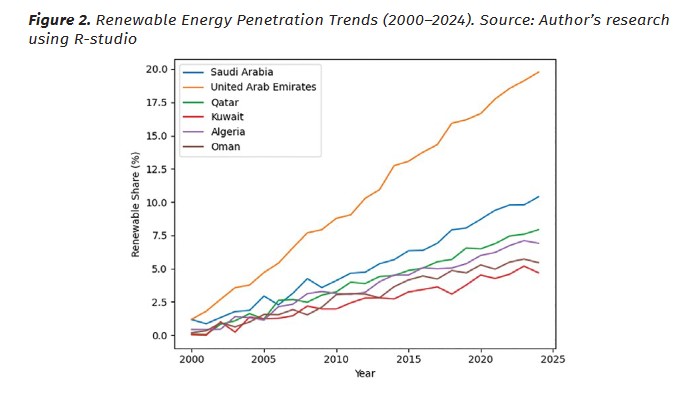
Renewable‑energy penetration has increased markedly across the six countries, though starting near zero in 2000. The United Arab Emirates leads with penetration exceeding 20 % by 2024, thanks to an ambitious policy and large projects. Saudi Arabia and Qatar follow, reaching roughly 10 % and 8 %, while Algeria and Oman climb toward 7–8 % and Kuwait lags at about 5–6 %.
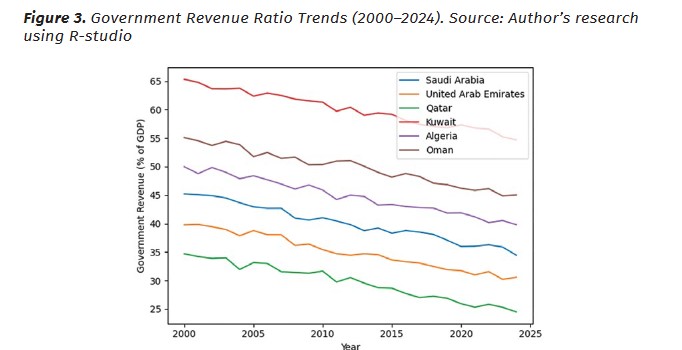
Across all exporters, government revenue as a share of GDP has declined, signaling reduced dependence on hydrocarbon income. Kuwait remains the highest, dropping from around 65 % to just under 55 %, while Saudi Arabia and the UAE fall from around 45 % and 40 % to roughly 35 % and 30 % respectively. Qatar moves from the low 30s to about 25 %, and Algeria and Oman drift from about 50 % toward the mid-40s.
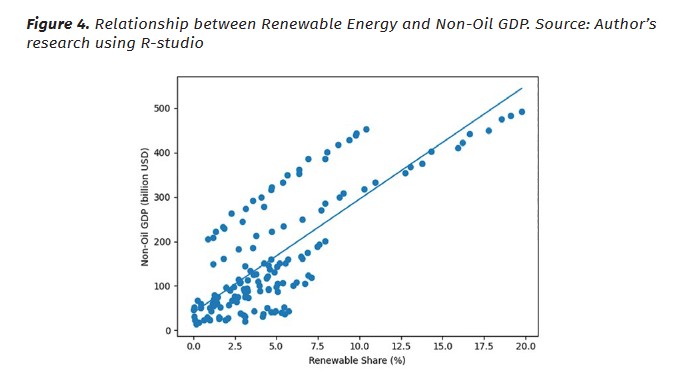
The scatter plot shows a clear positive relationship between renewable‑energy penetration and non-oil GDP levels. Countries and years with higher renewable shares tend to exhibit larger non-oil GDP, as evidenced by the upward-sloping fitted line. While there is dispersion in the data indicating that other factors also drive growth, the overall trend supports the idea that clean‑energy adoption complements economic diversification.
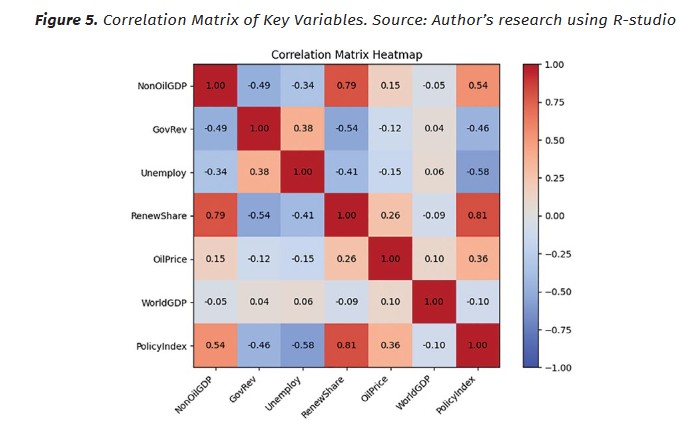
The heatmap reveals a strong positive correlation between renewable energy share and non-oil GDP (ρ ≈ 0.79), suggesting that clean energy adoption supports economic diversification. Similarly, the renewable policy index strongly correlates with both renewable share (ρ ≈ 0.81) and non-oil GDP (ρ ≈ 0.54). In contrast, government revenue and unemployment exhibit negative relationships with both diversification and policy indicators.
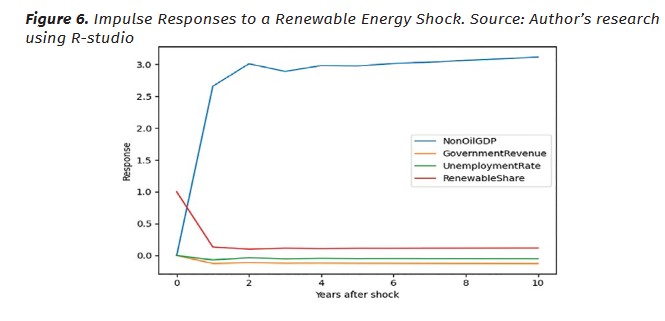
This figure plots the response of each variable to a one‑standard deviation increase in the renewable‑energy share. Non-oil GDP (blue) rises quickly, peaking around year 3 and remaining elevated over the horizon, indicating that renewable adoption stimulates broader economic activity. Government revenue (orange) dips slightly—reflecting reduced reliance on hydrocarbon revenues—then stabilizes near zero, suggesting minimal long-term fiscal drag. Unemployment (green) falls by up to 0.12 percentage points and stays below its baseline, consistent with job creation in clean‑energy sectors. The renewable share (red) itself experiences a large initial jump that decays but remains above zero, reflecting partial persistence of policy or investment shocks.
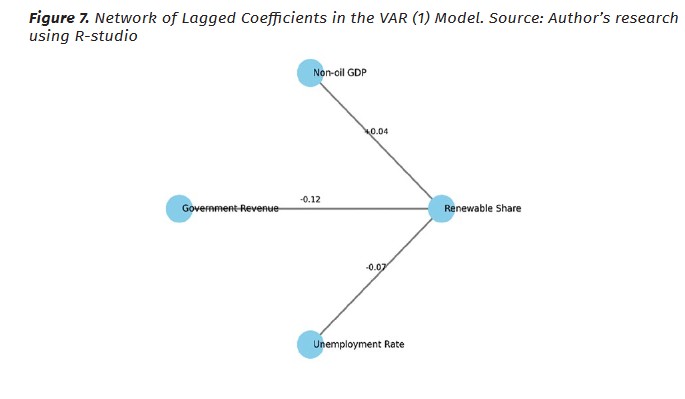
This network diagram visualizes the lagged relationships estimated in the VAR (1) model. Nodes represent the four endogenous variables (NonOil GDP, Government Revenue, Unemployment Rate, and Renewable Share). Directed edges show how a lagged change in one variable affects another; edge labels report the coefficient and significance (*** p < 0.01, ** p < 0.05, * p < 0.10). The strongest relationships are the autoregressive links (loops omitted for clarity): Non-oil GDP depends heavily on its own past, and Government Revenue strongly on its own past. Notably, lagged Non‑oil GDP positively influences the renewable share (0.04***), implying that economic expansion encourages renewable adoption, while lagged Government Revenue has little effect on renewables. Negative edges from renewable share to Government Revenue and to Unemployment Rate (coefficients –0.12 and –0.07) capture the slight fiscal and labor‑market improvements following renewable investment.
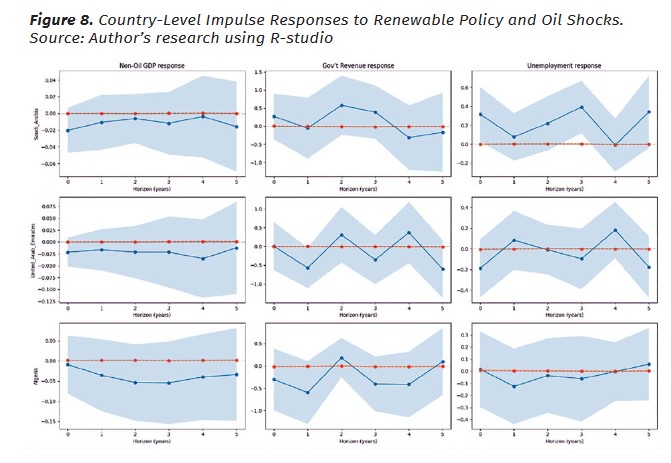
Figure 8 plots the IRFs for non-oil GDP, government revenue, and unemployment in Saudi Arabia, the UAE, and Algeria following both renewable policy shocks and oil price shocks. We observe that renewable policy shocks generally yield moderate positive effects on growth and employment, while reducing fiscal dependence slightly. In contrast, oil shocks produce weak or insignificant effects, suggesting that domestic renewable efforts may offer more stable macroeconomic benefits.
- Forecast scenario analysis
This section explores forward-looking scenarios for non-oil GDP under baseline and accelerated renewable energy adoption paths across six hydrocarbon-exporting MENA economies. Using structural forecast techniques from the panel SVAR model, we compare economic outcomes in 2035 under two distinct trajectories: continuation of current trends versus an enhanced renewable deployment strategy. These projections not only quantify potential gains from energy transition but also reflect the interplay between policy ambition and macroeconomic responsiveness.
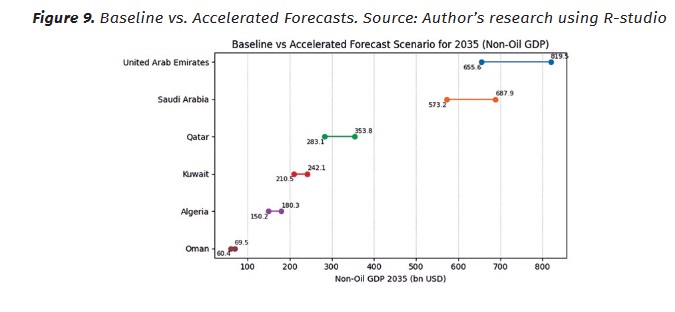
Figure 9 compares the 2035 non-oil GDP under baseline vs accelerated renewables across six hydrocarbon-exporting MENA countries. UAE and Saudi Arabia record the largest absolute gains (exceeding US$150 billion), while Qatar and Kuwait also rise from lower baselines. Algeria and Oman post notable proportional gains, highlighting country-specific potential tied to renewable ambition and capacity. Stronger policy and infrastructure (e.g., UAE) amplify outcomes; weaker frameworks mute them, underscoring renewables as an economic diversification and macro‑development opportunity.
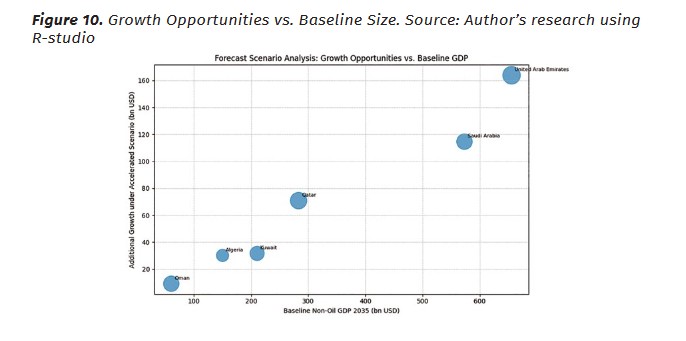
This bubble chart maps each country’s baseline non-oil GDP (x‑axis) against the additional growth under the accelerated scenario (y‑axis); bubble size reflects the strength of each country’s renewable‑energy policy index. Countries in the upper‑right quadrant (e.g., United Arab Emirates and Saudi Arabia) combine large economies with substantial extra growth, highlighting their capacity to capitalize on renewable investments. Qatar shows a strong opportunity relative to its size, whereas Kuwait and Algeria have moderate gains with smaller bubbles, signaling less ambitious policy support. Oman sits lower and to the left, indicating both a smaller economy and more modest gains. This chart visually ranks opportunities and underscores how policy ambition interacts with baseline size.
4.3. Sensitivity and model implications
This figure illustrates how macroeconomic variables respond to rising renewable policy ambition across six MENA hydrocarbon exporters. As the Renewable Policy Index increases, non-oil GDP grows across all countries, confirming that proactive renewable strategies align with economic diversification. Unemployment rates decline modestly, reflecting job creation potential in clean energy and associated sectors. Government revenue as a share of GDP decreases slightly, consistent with reduced fiscal reliance on hydrocarbons. Countries like the UAE and Saudi Arabia exhibit the strongest sensitivity due to their ambitious renewable targets and investments. These trends collectively support the hypothesis that renewable adoption enhances resilience and reduces macroeconomic volatility in oil-dependent economies.

Conclusion
This study demonstrates that accelerating renewable‐energy adoption in hydrocarbon-exporting MENA economies markedly enhances economic diversification: non-oil GDP rises across all countries, unemployment declines, and fiscal reliance on hydrocarbon revenues diminishes. By employing a panel SVAR with exogenous oil‑price and global‑demand shocks and a domestic policy index, the research provides novel, causal insights into how renewable shocks propagate through different macroeconomic channels. Scenario-based forecasts indicate that the United Arab Emirates and Saudi Arabia obtain the largest absolute gains from accelerated adoption, while smaller economies like Oman enjoy proportionally significant improvements. The findings underscore the importance of sustained investment in renewables, supportive policy frameworks, and proactive fiscal planning to ensure resilience during the transition. Collectively, the study adds value by filling a gap in exporter-specific analysis and by offering a replicable framework for scenario forecasting in resource-rich economies.
Recommendations
- Governments should design stable regulatory environments that encourage private investment in renewable projects, including clear bidding procedures, feed-in tariffs, and long-term procurement schedules. Removing fossil‑fuel subsidies and reinvesting windfall revenues into renewable infrastructure and human capital will accelerate the transition while safeguarding fiscal sustainability.
- The six exporters can benefit from joint renewable projects, cross-border grid integration, and shared financing mechanisms, such as regional green bonds and climate funds. Developing collaborative platforms for technology transfer and knowledge sharing—especially in storage, grid management, and AI-enabled forecasting—will amplify gains and reduce the costs of transition across the region.
Future work should extend the model to sectoral and microeconomic levels, examining employment effects within specific industries and incorporating household welfare and income distribution. Researchers could also integrate climate risk metrics, financial development indicators, and firm-level data to capture the interactions between renewable adoption, capital markets, and private investment flows.
References:
Alofaysan, H. (2024). The effect of environmental smart technology and renewable energy on carbon footprint: a sustainability perspective from the MENA region. Energies, 17(11). <doi.org/10.3390/en17112624>;
Dirir, S. A. (2023). Identifying the factors that drive renewable energy consumption in the MENA region. Business Economics and Management Research Journal, 6(2). <doi.org/10.58308/bemarej.1230694>;
Kahia, M., Ben Jebli, M., Belloumi, M. (2019). Analysis of the impact of renewable energy consumption and economic growth on carbon dioxide emissions in 12 MENA countries. Clean Technologies and Environmental Policy, 21(4). <doi.org/10.1007/s10098-019-01676-2>;
Kahia, M., Ben Jebli, M., Belloumi, M. (2019). Analysis of the impact of renewable energy consumption and economic growth on carbon dioxide emissions in 12 MENA countries. Clean Technologies and Environmental Policy, 21(4). <doi.org/10.1007/s10098-019-01676-2>;
Kouyakhi, N. R. (2022). CO₂ emissions in the Middle East: Decoupling and decomposition analysis of carbon emissions, and projection of its future trajectory. Science of the Total Environment (845), 157182. <doi.org/10.1016/j.scitotenv.2022.157182>;
Kularatne, C., Miyajima, K., Muir, D. (2024). Estimating the growth impact of economic transformation in Qatar. Review of Middle East Economics and Finance, 20(3). <doi.org/10.1515/rmeef-2024-0011>;
Lou, Q., Iqbal, N., Alraey, Y. (2024). Sensitivity to changes in oil prices, tax returns and the cross-section of stock returns: The present situation for net-oil exporting economies. Heliyon, 10(13). <doi.org/10.1016/j.heliyon.2024.e33119>;
Maashani, S. S. S., Gamal, A. A. M., Shaarani, A. Z., Rambeli, N., Zulkifli, N. (2025). The role of specific macroeconomic factors on tax revenue policy in an oil-dependent economy: Evidence from Oman. Review of Economics and Political Science. <doi.org/10.1108/reps-06-2024-0017>;
Magrassi, G. C., Lanza, A., Travisani, V. (2021). Saudi Arabia in transition: Opportunities for Italian-Saudi cooperation in the age of renewable energy (Thesis);
Matallah, S. (2024). MENA oil exporters need a renewable energy transition before the oil wells run dry: A special focus on innovation, financial development, and governance. Geological Journal, 59(3). <doi.org/10.1002/gj.4894>;
Mebrek, N., Louail, B., Riache, S. (2024). Do trade openness and foreign direct investment affect CO₂ emissions in the MENA region? New evidence from a panel ARDL regression. Economics and Environment. <doi.org/10.34659/eis.2024.91.4.972>;
Michailidis, M., Zafeiriou, E., Kantartzis, A., Galatsidas, S., Arabatzis, G. (2025). Governance, energy policy, and sustainable development: Renewable energy infrastructure transition in developing MENA countries. Energies, 18(11). <doi.org/10.3390/en18112759> ;
Miyake, S., Rispler, J., Teske, S. (2025). Solar and wind energy potentials in Australia: A GIS-based assessment for Australia’s ability to transition to net-zero emissions by 2050. Environmental Research Communications, 7(9), 095002. <doi.org/10.1088/2515-7620/adfc30>;
Mouffok, M. A., Mouffok, O., Bouabdallah, W., Souar, Y. (2025). Asymmetric Effect of Monetary and Fiscal Policy Uncertainty on the Energy Transition: Evidence from the United States. Globalization and Business, 10(19), pp. 23-40. <doi.org/10.35945/gb.2025.19.002>;
Poudineh, R., Sen, A., Fattouh, B. (2018). Advancing renewable energy in resource-rich economies of the MENA. Renewable Energy (123). <doi.org/10.1016/j.renene.2018.02.015>;
Satari Yuzbashkandi, S., Mehrjo, A., Eskandari Nasab, M. H. (2024). Exploring the dynamic nexus between urbanization, energy efficiency, renewable energies, economic growth, with ecological footprint: A panel cross-sectional autoregressive distributed lag evidence along Middle East and North Africa countries. Energy & Environment, 35(8). <doi.org/10.1177/0958305X231181672>;
Sharif Zadeh, A. (2024). Road to Net-Zero: Impact of economic development in the United Arab Emirates on greenhouse gas emissions as a result of substitution of conventional energy with renewable and clean energy sources. Doctoral thesis, RMIT University;
Shenavar, R. (2025). Transition to renewable energy in the Middle East: Challenges, opportunities, and the path to sustainability;
Zemrı, B. E. (2024). Forecasting the role of renewable energy on Algeria’s economic stability: ARIMAX model. International Journal of Business and Economic Studies, 6(2). <doi.org/10.54821/uiecd.1474631>.
Footnotes
[1] Miyake, S., Rispler, J., Teske, S. (2025). Solar and wind energy potentials in Australia: A GIS-based assessment for Australia’s ability to transition to net-zero emissions by 2050. Environmental Research Communications, 7(9), 095002, p. 2. <doi.org/10.1088/2515-7620/adfc30>.
[2] Shenavar, R. (2025). Transition to renewable energy in the Middle East: Challenges, opportunities, and the path to sustainability, p.18.
[3] Magrassi, G. C., Lanza, A., Travisani, V. (2021). Saudi Arabia in transition: Opportunities for Italian-Saudi cooperation in the age of renewable energy (Thesis), p. 10.
[4] Sharif Zadeh, A. (2024). Road to Net-Zero: Impact of economic development in the United Arab Emirates on greenhouse gas emissions as a result of substitution of conventional energy with renewable and clean energy sources. Doctoral thesis, RMIT University, p. 29.
[5] Kularatne, C., Miyajima, K., Muir, D. (2024). Estimating the growth impact of economic transformation in Qatar. Review of Middle East Economics and Finance, 20(3), p. 241. <doi.org/10.1515/rmeef-2024-0011>.
[6] Lou, Q., Iqbal, N., Alraey, Y. (2024). Sensitivity to changes in oil prices, tax returns and the cross-section of stock returns: The present situation for net-oil exporting economies. Heliyon, 10(13). <doi.org/10.1016/j.heliyon.2024.e33119>.
[7] Zemrı, B. E. (2024). Forecasting the role of renewable energy on Algeria’s economic stability: ARIMAX model. International Journal of Business and Economic Studies, 6(2), p. 92. <doi.org/10.54821/uiecd.1474631>.
[8] Maashani, S. S. S., Gamal, A. A. M., Shaarani, A. Z., Rambeli, N., Zulkifli, N. (2025). The role of specific macroeconomic factors on tax revenue policy in an oil-dependent economy: Evidence from Oman. Review of Economics and Political Science, p. 6. <doi.org/10.1108/reps-06-2024-0017>.
[9] Kahia, M., Ben Jebli, M., Belloumi, M. (2019). Analysis of the impact of renewable energy consumption and economic growth on carbon dioxide emissions in 12 MENA countries. Clean Technologies and Environmental Policy, 21(4), pp. 871-885. <doi.org/10.1007/s10098-019-01676-2>.
[10] Mebrek, N., Louail, B., Riache, S. (2024). Do trade openness and foreign direct investment affect CO₂ emissions in the MENA region? New evidence from a panel ARDL regression. Economics and Environment. <doi.org/10.34659/eis.2024.91.4.972>.
[11] Michailidis, M., Zafeiriou, E., Kantartzis, A., Galatsidas, S., Arabatzis, G. (2025). Governance, energy policy, and sustainable development: Renewable energy infrastructure transition in developing MENA countries. Energies, 18(11), p. 2759. <doi.org/10.3390/en18112759>.
[12] Satari Yuzbashkandi, S., Mehrjo, A., Eskandari Nasab, M. H. (2024). Exploring the dynamic nexus between urbanization, energy efficiency, renewable energies, economic growth, with ecological footprint: A panel cross-sectional autoregressive distributed lag evidence along Middle East and North Africa countries. Energy & Environment, 35(8), pp. 4386-4407. <doi.org/10.1177/0958305X231181672>.
[13] Mouffok, M. A., Mouffok, O., Bouabdallah, W., Souar, Y. (2025). Asymmetric Effect of Monetary and Fiscal Policy Uncertainty on the Energy Transition: Evidence from the United States. Globalization and Business, 10(19), pp. 23-40. <doi.org/10.35945/gb.2025.19.002>.
[14] Poudineh, R., Sen, A., Fattouh, B. (2018). Advancing renewable energy in resource-rich economies of the MENA. Renewable Energy (123), pp. 135-149. <doi.org/10.1016/j.renene.2018.02.015>.
[15] Kahia, M., Ben Jebli, M., Belloumi, M. (2019). Analysis of the impact of renewable energy consumption and economic growth on carbon dioxide emissions in 12 MENA countries. Clean Technologies and Environmental Policy, 21(4), pp. 871-885. <doi.org/10.1007/s10098-019-01676-2>.
[16] Kouyakhi, N. R. (2022). CO₂ emissions in the Middle East: Decoupling and decomposition analysis of carbon emissions, and projection of its future trajectory. Science of the Total Environment (845), 157182. <doi.org/10.1016/j.scitotenv.2022.157182>.
[17] Dirir, S. A. (2023). Identifying the factors that drive renewable energy consumption in the MENA region. Business Economics and Management Research Journal, 6(2), pp. 170-185. <doi.org/10.58308/bemarej.1230694>.
[18] Alofaysan, H. (2024). The effect of environmental smart technology and renewable energy on carbon footprint: a sustainability perspective from the MENA region. Energies, 17(11), p. 2624. <doi.org/10.3390/en17112624>.
[19] Matallah, S. (2024). MENA oil exporters need a renewable energy transition before the oil wells run dry: A special focus on innovation, financial development, and governance. Geological Journal, 59(3), pp. 838–853. <doi.org/10.1002/gj.4894>.
Downloads

Downloads
Published
Issue
Section
License

This work is licensed under a Creative Commons Attribution-ShareAlike 4.0 International License.
How to Cite
Share