
Oil Shocks, Renewable Energy, and Growth Regimes in Algeria: A Multiple-Threshold NARDL Analysis of CO₂ Emissions
DOI:
https://doi.org/10.35945/gb.2025.20.005Keywords:
Algeria, CO₂ emissions, MT-NARDL, growth regimes, renewable energy, oil shocksAbstract
This study employs the MT-NARDL model to examine the nonlinear relationship between economic growth, oil prices, renewable energy consumption, and CO₂ emissions in Algeria over 1980–2024. Allowing GDP per capita to switch across low, medium, and high regimes, the model captures asymmetric short- and long-run responses. The Environmental Kuznets Curve is rejected: no regime yields a significant long-run effect on emissions, evidencing the absence of an automatic decoupling threshold. Renewable energy is the only robust driver of permanent carbon reduction, cutting emissions by 0.155% for each additional 1% share, despite an initial “brown-build” uptick. Oil-price shocks exert merely transitory impacts, whereas medium-growth episodes re-ignite emissions after two years. Error-correction is rapid, yet hydrocarbon dependency persists. Aligning development with climate goals, therefore, requires a coherent policy package that couples accelerated clean-energy deployment, stringent efficiency standards, and economic diversification away from carbon-intensive sectors. By foregrounding regime-dependent asymmetries, the paper offers new empirical evidence for resource-rich economies.
Keywords: Algeria, CO₂ emissions, MT-NARDL, growth regimes, renewable energy, oil shocks.
Introduction
The relationship between economic growth and environmental protection has received widespread attention in the economic and environmental literature, as countries seek to achieve a balance between the requirements of development, on the one hand, and the mitigation of environmental degradation, on the other.[1] Economic activities, particularly those related to fossil fuel consumption, are among the main sources of carbon dioxide (CO₂) emissions,[2] placing them at the core of discussions on environmental sustainability. Conversely, renewable energy is emerging as a strategic alternative that contributes to reducing emissions and fostering the transition toward a green economy.[3] At the same time, oil prices remain a key factor shaping the economic and energy trajectories of many countries.[4]
In this context, Algeria is an important model for studying these interactions, due to its heavy reliance on oil and gas revenues as the primary source of GDP.[5] Therefore, per capita carbon dioxide emissions (CO₂ PER) are closely linked to per capita GDP (GDP PER) and global fluctuations in oil prices, reflecting the fragility of the economic structure in the face of external shocks.[6] Nevertheless, integrating renewable energy into the national energy mix is a fundamental step toward reducing the carbon footprint and promoting sustainable development.[7] At the theoretical level, the Classical studies assume a linear relationship between economic growth and environmental degradation.[8] However, empirical evidence reveals more complex dynamics characterized by asymmetry and dependence on different economic systems.[9] For example, rising per capita income may increase emissions at a certain stage of growth, while contributing to their reduction when higher levels are reached as a result of technological advancement and effective environmental policies, which is consistent with the Environmental Kuznets Curve (EKC) hypothesis.[10] In traditional studies, the NARDL model is often employed to analyze asymmetry in economic and environmental relationships by distinguishing between the effects of increases and decreases in the independent variables.[11] However, this approach remains limited as it restricts the analysis to only two regimes.[12]
To address this limitation, the MT-NARDL model was developed, allowing GDP per capita to be divided into several regimes at different levels (low, medium, and high).[13] This provides a more accurate understanding of the complex dynamics of the relationship between economic growth and carbon dioxide emissions, while also accounting for the role of oil prices as an external factor and the consumption of renewable energy as a transitional tool towards sustainable development. Therefore, adopting this model is particularly appropriate for the Algerian case and contributes to filling a gap in the literature by offering a comprehensive short- and long-term analysis that links economic growth, energy price fluctuations, and the energy transition in explaining the dynamics of per capita carbon emissions.
The remainder of this paper is organized as follows: Section 1 provides a comprehensive review of the existing literature, Section 2 describes the data and lays out the theoretical framework, Section 3 presents and analyzes the empirical findings, and Section 4 concludes with a summary and policy implications.
- Literature Review
Recent studies have increasingly examined the nexus between economic growth, energy consumption, and CO₂ emissions using nonlinear and asymmetric models, especially in oil-dependent economies. This literature can be grouped into two main strands: (i) those testing the Environmental Kuznets Curve (EKC) hypothesis across different growth regimes, and (ii) those comparing the effects of renewable versus conventional energy on emissions, with attention to short- and long-run dynamics.
Growth Regimes and the EKC Hypothesis: Several studies have explored whether the EKC hypothesis holds across low, medium, and high growth regimes. Found for South Africa that both energy consumption and income worsen environmental quality, with no EKC evidence.[14] Confirmed the EKC for Nigeria using nonlinear ARDL, showing that growth initially increases emissions but later reduces them.[15] Offered mixed EKC evidence across 25 OECD countries,[16] while rejected it for Korea, finding an N-shaped relationship instead.[17] Supported the EKC for India, noting that oil consumption and price shocks increase emissions, while FDI inflows validate the pollution haven hypothesis.[18]
Renewable vs. Conventional Energy and Oil Price Shocks: The second strand compares energy sources and their asymmetric effects. Found that renewable energy had no significant impact on the ecological footprint in major oil exporters,[19] while showed that renewables initially slow growth but become beneficial in the long run.[20] Confirmed that renewable energy reduces the ecological footprint, whereas natural resource rents increase it.[21] validated the N-shaped EKC for some Asian countries, with renewables reducing emissions and nonrenewables increasing them.[22] found asymmetric effects in Canada: positive shocks in renewables reduce emissions, while negative growth shocks worsen environmental quality.[23] Showed that both positive and negative shocks in renewable energy reduce CO₂ emissions in Saudi Arabia.[24] found asymmetric cointegration in Pakistan, with no significant link between growth and emissions.[25] In a rare study on Algeria, found no EKC evidence: renewables reduce emissions, while growth increases them.
Despite the wealth of previous studies analyzing the relationship between economic growth and emissions, most remain limited by traditional single-threshold NARDL models, which limit their ability to capture nonlinear changes in emissions across multiple growth stages. Most also overlook the impact of recurrent oil shocks on emissions in energy-exporting economies, such as Algeria. Hence, the importance of this study, which fills this gap by applying the multi-threshold MT-NARDL model to analyze the nonlinear and bidirectional causality between growth, renewables, and emissions.[26] highlighted short-run links between renewables, trade, and oil prices in Tunisia.[27] asymmetric interactions between economic growth, oil prices, and renewable energy in explaining CO₂ emissions. This study enhances theoretical and applied understanding of climate transition policies in similar economies.
- Data and Theoretical Framework
2.1. Data sources
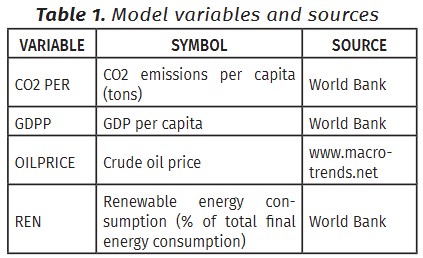
The definitions and measurement units of all variables are presented in Table 1 below.
2.2. The theoretical framework
2.2.1. MT-NARDL Model
Given the variation in economic policy objectives across the low, medium, and high transition stages, this study employs the MT-NARDL (Multiple Threshold Nonlinear Autoregressive Distributed Lag) model developed by Pal and Mitra (2015, 2016).[28] This model overcomes the limitations of the traditional NARDL framework, which is restricted to two cases: an increase and a decrease, by allowing the variable of interest (GDP per capita) to be partitioned into several regimes at different levels (low, medium, and high).
The MT-NARDL model captures asymmetry by introducing multiple threshold values, enabling the relationship between variables to change according to these thresholds. This feature allows for the analysis of the dynamic relationship between economic growth and carbon dioxide emissions in both the short and long run, while also considering the role of oil prices as an external factor and renewable energy consumption as part of the transition toward sustainability.
To apply the MT-NARDL model in examining the relationship between per capita carbon dioxide emissions (CO₂PER) and economic variables, namely per capita gross domestic product (GDPPER), oil prices (OILPRICE), and renewable energy consumption (REN), we proceed as follows:[29]
- Stage 1: Compute the per capita GDP growth rate by taking the first difference of its logarithm:
- Stage 2: We determine the threshold values using quantiles:
- : represents the lower quantile (e.g., 25%);
- : represents the upper quantile (e.g., 75%).
- Stage 3: We construct three regimes (Regimes) for GDPP:
- Regime 1 : Low GDP per capita growth (less than Q₁):
- Regime 2 : Medium GDP per capita growth (between Q₁ and ):
- Regime 3 : High GDP per capita growth (greater than ):
- Stage 4: Step 4 involves embedding the GDP regimes within the MT-NARDL specification as explanatory variables.
Where X represents the explanatory variables, namely (oil, ren), and is Error term.
- Stage 5: In this stage, dedicated to model specification and estimation, we incorporate the three GDP regimes into the MT-NARDL framework, where the dependent variable is per capita CO₂ emissions (CO₂per). The independent variables consist of oil prices (OILPRICE), renewable energy consumption (REN), along with the three GDP regimes. The model is subsequently estimated using EViews 13 under the general MT-NARDL specification, enabling the identification of the long-run relationship as well as the short-run dynamics through the Error Correction Model (ECM).
The general form of the MT-NARDL specification can be expressed as:
2.2.2. The three GDP regimes in Algeria
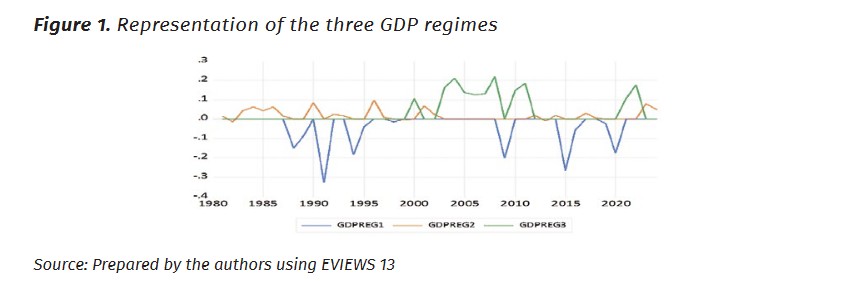
Figure 1 represents three different GDP regimes, which in turn reflect the varying stages of economic activity and their impact on environmental variables. The first regime (GDPREG1, low growth, blue line) starts near zero in the early 1980s, then declines to around 2 in the mid-1990s and below 6 by 2020. These negative values reflect periods of economic slowdown, where industrial contraction weakens energy demand and reduces emissions. However, this decline is not driven by environmental policies or efficiency gains, but by financial crises and oil-price volatility, especially after 2000. Thus, emission reductions come at the expense of growth, without achieving sustainable transformation. The second regime (GDPREG2, average growth, orange line) begins close to zero in the early 1980s, rises to about +3 in the late 1990s, and exceeds +5 by 2020. This steady increase is accompanied by rising environmental pressures due to industrial expansion, higher transport activity, and accelerating urbanization. Energy policies during this phase fail to promote efficiency or a shift to cleaner sources, so each additional unit of output directly increases emissions. The third regime (GDPREG3, high growth, green line) starts near +1 in the late 1980s, reaches +4 by 2005, and stabilizes around +4.5 by 2020. The post-2010 plateau suggests that high growth is beginning to generate mitigating effects, possibly through improved efficiency, clean technology adoption, or stricter environmental policies. Nevertheless, since values remain positive, Algeria has not yet fully decoupled growth from emissions. Capitalizing on this trend requires accelerating renewable energy deployment, improving consumption efficiency, and enforcing stricter environmental regulations. Overall, stagnation (GDPREG1) reduces emissions unsustainably, moderate growth (GDPREG2) intensifies environmental pressures, and high growth (GDPREG3) shows early signs of mitigation, but still needs stronger institutional and technological support to ensure a green and sustainable growth path.
- Empirical Results and Discussion
Before estimating the model, all variables were transformed into their natural logarithms, except for the renewable energy (REN) variable, which is expressed as a percentage. This transformation was applied to reduce variance and to facilitate the interpretation of elasticity coefficients.
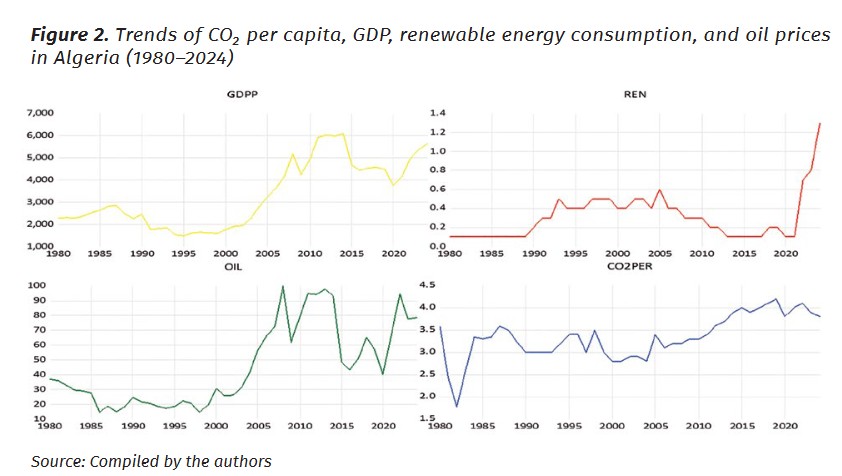
3.1. Economic and environmental trends in Algeria during the period 1980–2024
Historically, Algeria’s economic growth has been closely tied to oil revenues, with per capita GDP rising sharply during the mid-1980s and again following the oil boom after 2000. However, this growth came at an environmental cost, as per capita carbon dioxide emissions doubled from two to four tons, highlighting the absence of decoupling between economic expansion and environmental impact. The economy remains highly vulnerable to oil price fluctuations, which directly affect financial stability. At the same time, renewable energy consumption remained below 1% until a modest increase after 2019, reflecting only tentative steps toward diversifying energy sources and reducing carbon dependence.
3.2. Descriptive statistics
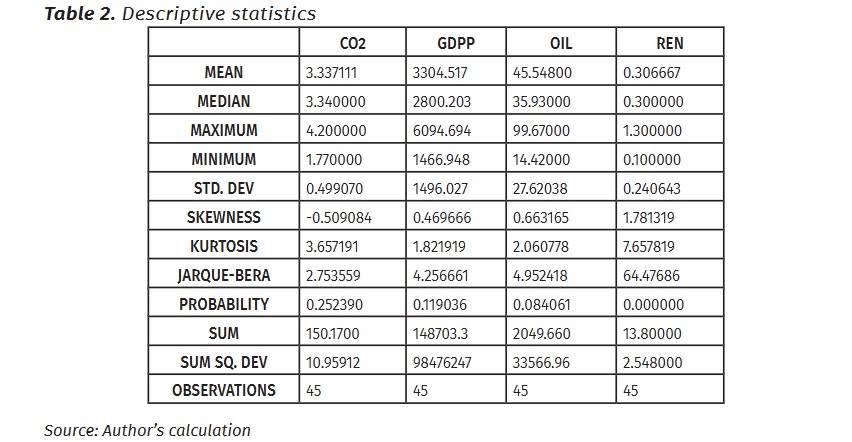
We note from the results in Table 2 that, over the 45-year sample, per capita CO₂ emissions averaged 3.34 tons, with moderate dispersion and an approximately normal distribution. Per capita GDP averaged about US$3,305 but displayed wide variation (±US$1,496), peaking at US$6,095, with a slight right skew. Oil prices averaged US$45.6 per barrel, ranging from US$14.4 to US$99.7, confirming substantial market volatility; their distribution is close to normal. The share of renewable energy was very low, averaging only 0.31% of total final energy use and never exceeding 1.3%. This variable is highly right-skewed and clearly non-normal.
3.3. Testing the Optimal Lag Lengths for the MT-NARDL Model
Based on the optimal lag model selection criteria using the Akaike Information Criterion (AIC), the MT-NARDL (1,1,3,0,1,2) model was selected as the most appropriate to represent the relationship between the variables under study. This specification indicates that the optimal lag order is: one lag for LCO2, one lag for GDPREG1, three lags for GDPREG2, no lag for GDPREG3, one lag for REN, and two lags for LOIL. The adoption of this model is attributed to its achievement of the lowest AIC value (−2.562876), making it the most statistically efficient compared to the other evaluated models.
3.4. Time Series Stationarity Test
Prior to undertaking time series analysis, it is crucial to assess the stationarity of the data. This requires testing whether the series exhibits a unit root. Accordingly, the Augmented Dickey-Fuller (ADF) test and the Phillips-Perron (PP) test, which are among the most widely applied conventional unit root tests, are employed in this study. The corresponding results are presented in Tables 3-4 below.

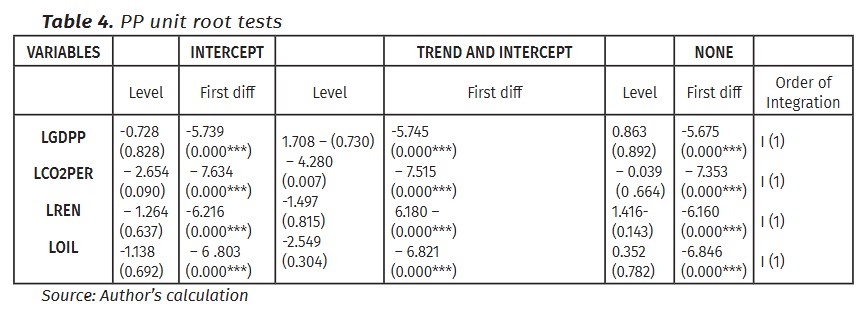
According to the results of the unit root tests (ADF and PP), all variables were found to be non-stationary at the I(0) level. To achieve stationarity, first differencing was applied. The unit root analysis confirmed that all variables became stationary at the I(1) level, as reported in Tables 3 and 4. These findings enabled us to proceed with the MT-NARDL model. Furthermore, the optimal lag length for the vector autoregressive (VAR) model was determined to be one, as consistently indicated by the majority of lag selection criteria, including FPE, AIC, SC, and HQ. Although the LR test suggested lag four, the convergence of the other criteria supports the choice of one lag as the most appropriate specification for the model under study.
3.5. Bounds of cointegration test
To examine the presence of a long-run equilibrium relationship among the variables, the bounds testing procedure was employed. This involved calculating the F-statistic and comparing it against the critical values reported by Pesaran et al. (2001). The corresponding results are presented in Table 6.
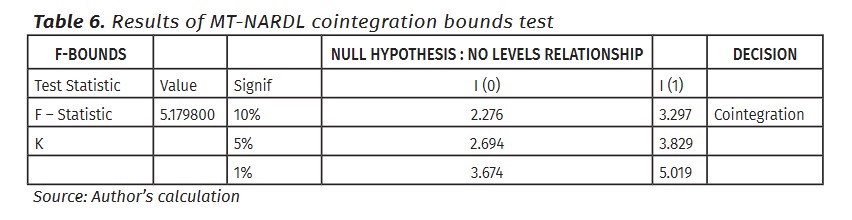
The Pesaran-Shin-Smith bounds test (F = 5.18) rejects the null of no cointegration at the 1% level, confirming a stable long-run relationship among CO₂ emissions, growth regimes, renewable energy, and oil prices and justifying the use of the MT-NARDL framework.
3.6. MT- NARDL long-run form
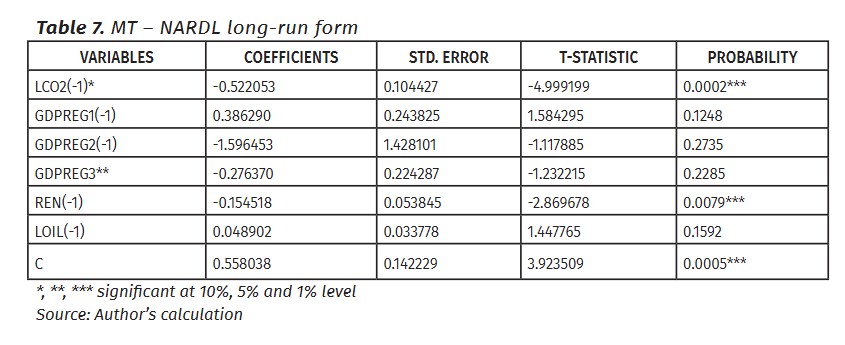
We observe from the long-run MT-NARDL equilibrium equation (1984–2024) that CO₂ emissions move consistently with the explanatory variables. The error correction coefficient (-0.522) indicates that 52% of any shock is corrected within one year, confirming a relatively rapid return to equilibrium. Renewable energy (REN) emerges as the only significant long-run driver: a permanent 1% increase in its share reduces emissions by 0.155%, underscoring the central role of clean energy investment in mitigation policy. By contrast, none of the three growth regimes exerts a statistically significant long-run effect: the low-growth regime (GDPREG1) shows a positive but insignificant coefficient (0.386), the medium-growth regime (GDPREG2) a negative but insignificant coefficient (-1.596), and the high-growth regime (GDPREG3) a negative but insignificant coefficient (-0.276). This outcome suggests that Algeria has not yet attained the income threshold or structural transformation needed for automatic decoupling. Real oil prices (LOIL) are neutral in the long run (0.049, not significant), reflecting continued dependence on hydrocarbons without sustainable demand-side adjustments. Overall, sustained emissions reductions will require expanding renewable energy, accelerating the shift away from energy-intensive industries, and redesigning growth strategies to move the economy beyond the critical “tipping point” that current GDP regimes have failed to deliver.
3.7. MT_NARDL short-run form
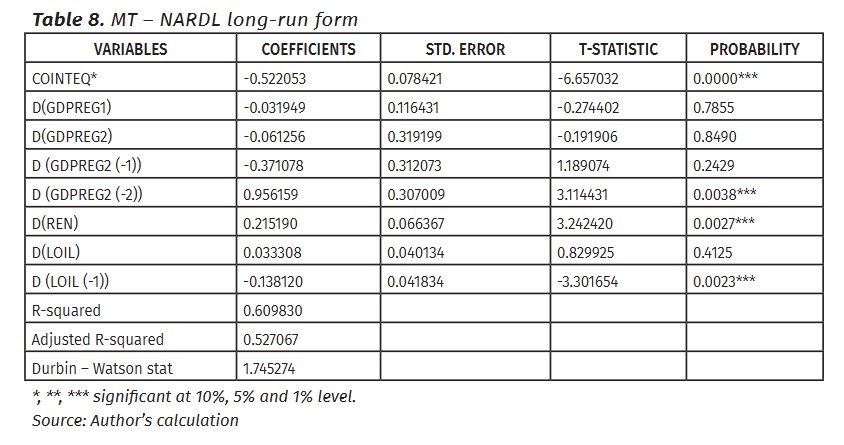
The short-run results of the MT-NARDL model, shown in Table 8, reveal that 52% of any departure from the long-run CO₂ path is corrected within one year (COINTEQ –0.522***), underscoring rapid system resilience. Low-growth (GDPREG1) and current-period medium-growth (GDPREG2) impulses leave emissions unchanged, but the medium-growth impulse delivered two years earlier (GDPREG2(–2)) becomes strongly positive (+0.956**), evidencing a delayed upswing in energy-intensive activity. Renewable-energy deployment (D(REN)) exerts an immediate, positive footprint (+0.215**) as construction and installation phases dominate, an effect that is later reversed by the long-run contraction shown in the equilibrium equation. Oil-price shocks carry no contemporaneous weight (D(LOIL) 0.033), yet a price rise lagged one period (D(LOIL (–1)) significantly dampens emissions (–0.138**) through curtailed fossil-fuel use or brief fuel-switching. These inter-temporal and regime-specific channels highlight the need for flexible policy instruments that anticipate lagged responses, exploit temporary price incentives, and accelerate the point at which renewable infrastructure costs give way to sustained carbon savings.
3.8. Diagnostic Tests
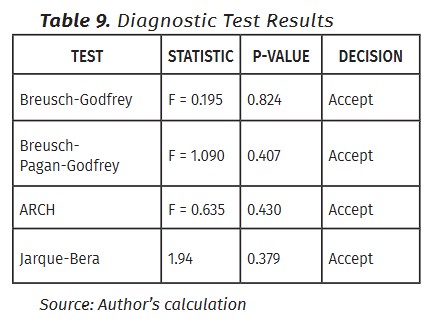
We note from the results in Table 9 for the diagnostic tests applied to the MT-NARDL model, including the ARCH test for conditional variance heteroskedasticity, the Breusch-Pagan-Godfrey test for heteroscedasticity, the Breusch-Godfrey test for detecting serial correlation, and the Jarque-Bera test for normality, that the findings confirm the model satisfies the required statistical assumptions. Its validity was established at the 5% significance level across all tests, ensuring the robustness and reliability of the estimated results.
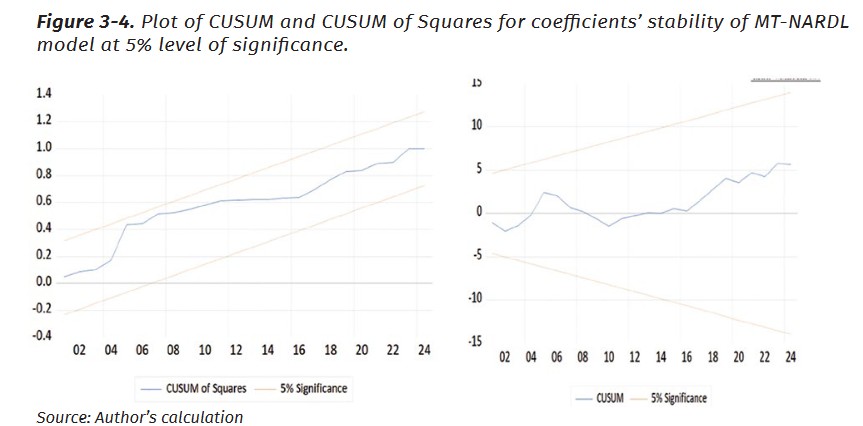
We note from Figures 3 and 4 that the CUSUM and CUSUMSQ tests are used to assess the stability of the model. In the case of Algeria, both statistics remain within the 5% significance bounds, indicating no structural breaks or deviations during the study period.
3.9. The cumulative dynamic multiplier
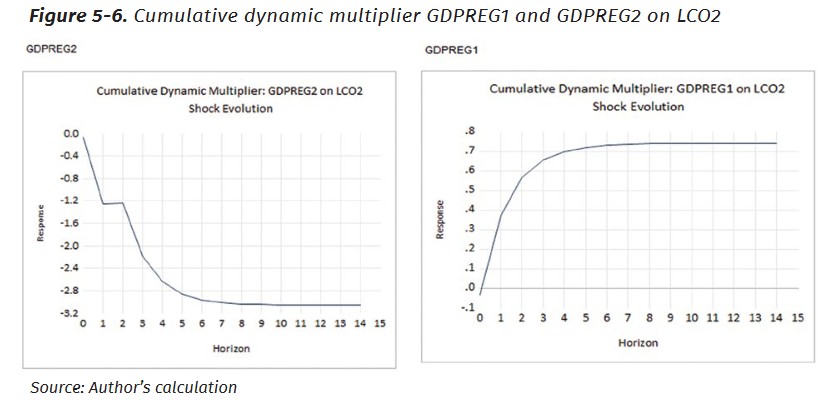
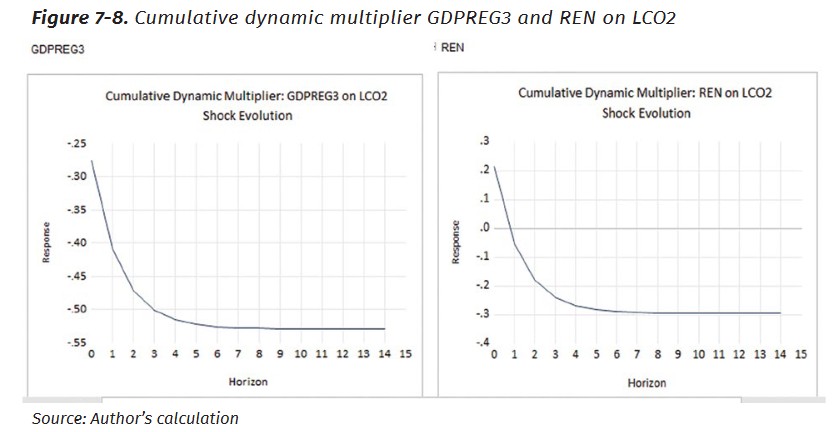
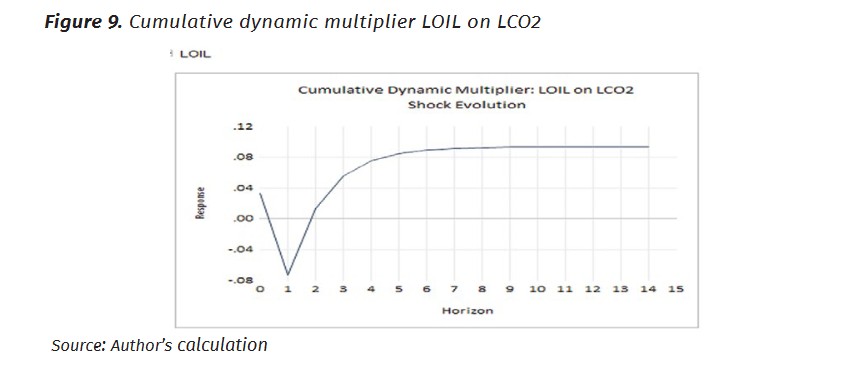
Figure 5 shows that the multiplier of GDPREG1 (low-growth regime) on per-capita CO₂ rises to about 0.7 after five–six years and then stabilises near 0.5. This “recession footprint” reflects the growing carbon-intensity of surviving plants: outdated kilns, furnaces, and vehicles remain in use, maintenance is deferred, and no cleaner capital is adopted, so emissions per unit of GDP edge up even while aggregate output is flat.
Figure 6 displays the multiplier for GDPREG2 (medium-growth regime); it falls steeply to –2.8 over nine–ten years. Sustained, but not spectacular, income growth finances building retrofits, more efficient industrial boilers, and early solar water-heaters, while tighter standards and subsidy schemes begin to bite. The result is a sizeable cumulative cut in CO₂ despite continued economic expansion.
Figure 7 plots the multiplier for GDPREG3 (high-growth regime); it oscillates between –0.5 and +0.45 before settling at –0.3. At this stage, the economy can fund green R&D and grid-scale renewables, yet higher disposable income also boosts transport, air-conditioning, and appliance ownership. These offsetting forces yield a near-zero net effect, underscoring that rapid growth alone is insufficient; complementary carbon-pricing or trading instruments are needed to tip the balance decisively downward.
Figure 8 illustrates the multiplier of renewable-energy consumption. It climbs to +0.34 after six–seven years and then plateaus at +0.3, revealing a short- to medium-term “brown-build” phase: emissions embodied in panel, turbine, and transmission-line fabrication outweigh the carbon savings until the new capacity fully displaces fossil generation. Policies that shorten this pay-back period recycled materials, domestic manufacturing standards, and streamlined permitting, are therefore essential.
Figure 9 traces the multiplier of oil-price shocks. An initial spike to +0.12 is quickly reversed; the curve ends at –0.04. The temporary uptick reflects a drawdown of cheaper, dirtier backup fuels, while the subsequent decline signals conservation and modal shifts once high prices persist. The overall effect is small, confirming that price cycles must be reinforced by durable clean energy incentives if they are to deliver structural decarbonisation.
3.10. Discussion of Findings and Contribution
The results showed that the relationship between economic growth and carbon dioxide emissions in Algeria goes beyond traditional linear models or the Environmental Kuznets Curve (EKC). It was found to be asymmetric, multi-phased, and dependent on the level of development and energy consumption patterns. Long-run estimates show none of the three growth regimes (low, medium, high) exerts a significant effect, confirming that structural dependence on carbon-intensive sectors and weak green policy have so far prevented any decoupling threshold. Short-run dynamics are more nuanced: medium growth (GDPREG2) turns emission-positive after two years (0.956), whereas high growth (GDPREG3) brings no offsetting relief, revealing the absence of complementary mitigation instruments. Renewable-energy penetration is the only robust lever, delivering a permanent 0.155% cut in CO₂ per additional 1% share, yet it imposes a transitional “brown” bump (+0.215%) as infrastructure is built. Lagged oil-price increases curb emissions (−0.138%), evidencing a temporary behavioral substitution window. Collectively, the results refute growth-only prescriptions and call for an integrated package of renewables scale-up, efficiency gains, and regulatory reform. The study’s contribution is (i) empirical documentation of asymmetric, multi-regime impacts, (ii) quantification of short-term renewable-expansion costs against long-term gains, and (iii) disclosure of conditional, delayed responses of oil prices and growth regimes insights, especially pertinent for rentier economies.
Conclusion
Algeria represents a suitable case study for examining the nonlinear, multi-stage relationship between economic growth and carbon dioxide emissions. This study employed the MT-NARDL model over the period 1984–2024. The results show that the Environmental Kuznets Curve does not apply, as none of the three growth regimes had a significant long-run effect, reflecting the persistence of carbon-intensive industries and the absence of an inflection point. Renewable energy emerged as the key driver of mitigation: a 1% increase in its share reduces emissions by 0.155% in the long run, despite a temporary rise in the short run due to infrastructure-related costs. Oil prices had no structural impact but showed a short-run negative effect after one year, indicating limited behavioral adjustments rather than a shift in the energy system.
Based on these findings, four policy directions are recommended: (1) restructure the industrial model by reducing reliance on carbon-intensive sectors and integrating energy efficiency into growth strategies; (2) expand solar and wind investments while minimizing their ecological footprint through local manufacturing, recycling, and technology development; (3) channel surplus revenues from high oil prices into financing the energy transition; and (4) diversify the energy mix to gradually reduce dependence on hydrocarbons. Overall, Algeria stands at a decisive crossroads: either maintain its carbon-intensive trajectory or adopt a sustainable development model centered on renewable energy, efficiency, and strong regulatory frameworks.
References:
Ahmed, H., Hamza, K., Abdelillah, K., Boudjemaa, B., Achwak, B., Lila, A. (2024). The Future of Investment in Renewable Energies and Its Role in Achieving the Dimensions of Sustainable Development in Algeria. In Artificial Intelligence, Digitalization. <doi.org/10.1007/978-3-031-67531-7_6>;
Ali, A., Radulescu, M., Balsalobre-Lorente, D. (2023). A dynamic relationship between renewable energy consumption, nonrenewable energy consumption, economic growth, and carbon dioxide emissions: Evidence from Asian emerging economies. Energy & Environment, 34(8), 3529-3552. <doi.org/10.1177/0958305X231151684>;
Baz, K., Xu, D., Ali, H., Ali, I., Khan, I., Khan, M. M., Cheng, J. (2020). Asymmetric impact of energy consumption and economic growth on ecological footprint: using asymmetric and nonlinear approach. Science of the total environment, 718, 137364. <doi.org/10.1016/j.scitotenv.2020.137364>;
Brini, R., Amara, M., Jemmali, H. (2017). Renewable energy consumption, international trade, oil price and economic growth inter-linkages: The case of Tunisia. Renewable and Sustainable Energy Reviews, 76, 620-627. <doi.org/10.1016/j.rser.2017.03.067>;
Çakmak, E. E., Acar, S. (2022). The nexus between economic growth, renewable energy and ecological footprint: An empirical evidence from most oil-producing countries. Journal of Cleaner Production, 352, 131548. <doi.org/10.1016/j.jclepro.2022.131548>;
Chou, C. H., Ngo, S. L., Tran, P. P. (2023). Renewable energy integration for sustainable economic growth: Insights and challenges via bibliometric analysis. Sustainability, 15(20), 15030. <doi.org/10.3390/su152015030>;
Elbadri, M., Bsikre, S., Alamari, O., Balcilar, M. (2023, August). Nexus between renewable energy consumption, economic growth, and CO2 emissions in Algeria: New evidence from the Fourier‐Bootstrap ARDL approach. In Natural Resources Forum, Oxford, UK: Blackwell Publishing Ltd., Vol. 47, No. 3, 393-412. <doi.org/10.1111/1477-8947.12292>;
Erdoğan, E., Serin Oktay, D., Manga, M., Bal, H., Algan, N. (2024). Examining the effects of renewable energy and economic growth on carbon emission in Canada: Evidence from the nonlinear ARDL approaches. Evaluation Review, 48(1), 63-89. <doi.org/10.1177/0193841X231166973>;
Erdogan, S., Okumus, I., Guzel, A. E. (2020). Revisiting the Environmental Kuznets Curve hypothesis in OECD countries: the role of renewable, non-renewable energy, and oil prices. Environmental Science and Pollution Research, 27(19), 23655-23663. <doi.org/10.1007/s11356-020-08520-x>;
Feng, Y., Zhao, T. (2022). Exploring the nonlinear relationship between renewable energy consumption and economic growth in the context of global climate change. International Journal of Environmental Research and Public Health, 19(23), 15647. <doi.org/10.3390/ijerph192315647>;
Georgescu, I., Kinnunen, J. (2025). Nonlinear Effects of GDP Regimes, Renewable Energy, and Urbanization on Finland’s Ecological Footprint: An MT-NARDL Approach. World Development Sustainability, 100235. <doi.org/10.1016/j.wds.2025.100235>;
Gülcü, A. (2025). Essays on financialization, income inequality and growth. <hdl.handle.net/11511/114100>;
Hadji, Y., Abderrahmane, A. B. (2024). Analyzing the impact of oil price fluctuations on economic growth in Algeria: an empirical study. Theoretical & Applied Economics, 31(3). <store.ectap.ro/articole/1762.pdf>;
Koc, S., Bulus, G. C. (2020). Testing validity of the EKC hypothesis in South Korea: role of renewable energy and trade openness. Environmental Science and Pollution Research, 27(23), 29043-29054. <doi.org/10.1007/s11356-020-09172-7>;
Liu, X., Latif, K., Latif, Z., Li, N. (2020). Relationship between economic growth and CO2 emissions: does governance matter? Environmental Science and Pollution Research, 27(14), 17221-17228. <doi.org/10.1007/s11356-020-08142-3>;
Lu, F., Ma, F., Feng, L. (2024). Carbon dioxide emissions and economic growth: New evidence from GDP forecasting. Technological Forecasting and Social Change, 205, 123464. <doi.org/10.1016/j.techfore.2024.123464>;
Mahajan, M., Sah, A. N. (2025). CO2 emissions response to GDP and crude oil price shocks: evidence from India and China using SVAR Model. Sustainable Futures, 9, 100479. <doi.org/10.1016/j.sftr.2025.100479>;
Mahmood, H., Furqan, M., Hassan, M. S., Rej, S. (2023). The environmental Kuznets Curve (EKC) hypothesis in China: A review. Sustainability, 15(7), 6110. <doi.org/10.3390/su15076110>;
Montagna, S., Huang, L., Long, Y., & Yoshida, Y. (2025). Sectoral economic complexity and environmental degradation: a sectoral perspective on the EKC hypothesis. Humanities and Social Sciences Communications, 12(1), 1-24. <doi.org/10.1057/s41599-025-04820-0>;
Mujtaba, A., Jena, P. K. (2021). Analyzing asymmetric impact of economic growth, energy use, FDI inflows, and oil prices on CO2 emissions through NARDL approach. Environmental Science and Pollution Research, 28(24), 30873-30886. <doi.org/10.1007/s11356-021-12660-z>;
Mukhtarov, S. (2024). Oil prices and the renewable energy transition: Empirical evidence from China. Utilities Policy, 91, 101840. <doi.org/10.1016/j.jup.2024.101840>;
Musibau, H. O., Shittu, W. O., Ogunlana, F. O. (2021). The relationship between environmental degradation, energy use and economic growth in Nigeria: new evidence from non-linear ARDL. International Journal of Energy Sector Management, 15(1), 81-100. <doi.org/10.1108/IJESM-04-2019-0016>;
Saint Akadiri, S., Bekun, F. V., Sarkodie, S. A. (2019). Contemporaneous interaction between energy consumption, economic growth and environmental sustainability in South Africa: what drives what? Science of the total environment, 686, 468-475. <doi.org/10.1016/j.scitotenv.2019.05.421>;
Sreenu, N. (2022). Impact of FDI, crude oil price and economic growth on CO2 emission in India: -symmetric and asymmetric analysis through ARDL and non-linear ARDL approach. Environmental Science and Pollution Research, 29(28), 42452-42465. <doi.org/10.1007/s11356-022-19597-x>;
Tabash, M. I., Ahmed, A., Issa, S. S., Mansour, M., Varma, M., Al-Absy, M. S. M. (2024). Multiple Behavioral Conditions of the Forward Exchange Rates and Stock Market Return in the South Asian Stock Markets During COVID-19: A Novel MT-QARDL Approach. Computation, 12(12), 233. <doi.org/10.3390/computation12120233>;
Toumi, S., Toumi, H. (2019). Asymmetric causality among renewable energy consumption, CO2 emissions, and economic growth in KSA: evidence from a non-linear ARDL model. Environmental Science and Pollution Research, 26(16), 16145-16156. <doi.org/10.1007/s11356-019-04955-z>;
Udeagha, M. C., Breitenbach, M. C. (2023). On the asymmetric effects of trade openness on CO2 emissions in SADC with a nonlinear ARDL approach. Discover Sustainability, 4(1), 2. <doi.org/10.1007/s43621-022-00117-3>;
Ullah, A., Ahmed, M., Raza, S. A., Ali, S. (2021). A threshold approach to sustainable development: nonlinear relationship between renewable energy consumption, natural resource rent, and ecological footprint. Journal of environmental management, 295, 113073. <doi.org/10.1016/j.jenvman.2021.113073>;
Yang, Z., Solangi, Y. A. (2024). Analyzing the relationship between natural resource management, environmental protection, and agricultural economics for sustainable development in China. Journal of Cleaner Production, 450, 141862.
Footnotes
[1] Yang, Z., Solangi, Y. A. (2024). Analyzing the relationship between natural resource management, environmental protection, and agricultural economics for sustainable development in China. Journal of Cleaner Production, 450, 141862.
[2] Lu, F., Ma, F., Feng, L. (2024). Carbon dioxide emissions and economic growth: New evidence from GDP forecasting. Technological Forecasting and Social Change, 205, 123464. <doi.org/10.1016/j.techfore.2024.123464>.
[3] Chou, C. H., Ngo, S. L., Tran, P. P. (2023). Renewable energy integration for sustainable economic growth: Insights and challenges via bibliometric analysis. Sustainability, 15(20), 15030. <doi.org/10.3390/su152015030>.
[4] Mukhtarov, S. (2024). Oil prices and the renewable energy transition: Empirical evidence from China. Utilities Policy, 91, 101840. <doi.org/10.1016/j.jup.2024.101840>.
[5] Hadji, Y., Abderrahmane, A. B. (2024). Analyzing the impact of oil price fluctuations on economic growth in Algeria: an empirical study. Theoretical & Applied Economics, 31(3). <store.ectap.ro/articole/1762.pdf>.
[6] Mahajan, M., Sah, A. N. (2025). CO2 emissions response to GDP and crude oil price shocks: evidence from India and China using SVAR Model. Sustainable Futures, 9, 100479. <doi.org/10.1016/j.sftr.2025.100479>.
[7] Ahmed, H., Hamza, K., Abdelillah, K., Boudjemaa, B., Achwak, B., Lila, A. (2024). The Future of Investment in Renewable Energies and Its Role in Achieving the Dimensions of Sustainable Development in Algeria. In Artificial Intelligence, Digitalization. <doi.org/10.1007/978-3-031-67531-7_6>.
[8] Liu, X., Latif, K., Latif, Z., Li, N. (2020). Relationship between economic growth and CO2 emissions: does governance matter? Environmental Science and Pollution Research, 27(14), 17221-17228. <doi.org/10.1007/s11356-020-08142-3>.
[9] Montagna, S., Huang, L., Long, Y., & Yoshida, Y. (2025). Sectoral economic complexity and environmental degradation: a sectoral perspective on the EKC hypothesis. Humanities and Social Sciences Communications, 12(1), 1-24. <doi.org/10.1057/s41599-025-04820-0>.
[10] Mahmood, H., Furqan, M., Hassan, M. S., Rej, S. (2023). The environmental Kuznets Curve (EKC) hypothesis in China: A review. Sustainability, 15(7), 6110. <doi.org/10.3390/su15076110>.
[11] Mujtaba, A., Jena, P. K. (2021). Analyzing asymmetric impact of economic growth, energy use, FDI inflows, and oil prices on CO2 emissions through NARDL approach. Environmental Science and Pollution Research, 28(24), 30873-30886. <doi.org/10.1007/s11356-021-12660-z>.
[12] Udeagha, M. C., Breitenbach, M. C. (2023). On the asymmetric effects of trade openness on CO2 emissions in SADC with a nonlinear ARDL approach. Discover Sustainability, 4(1), 2. <doi.org/10.1007/s43621-022-00117-3>.
[13] Tabash, M. I., Ahmed, A., Issa, S. S., Mansour, M., Varma, M., Al-Absy, M. S. M. (2024). Multiple Behavioral Conditions of the Forward Exchange Rates and Stock Market Return in the South Asian Stock Markets During COVID-19: A Novel MT-QARDL Approach. Computation, 12(12), 233. <doi.org/10.3390/computation12120233>.
[14] Saint Akadiri, S., Bekun, F. V., Sarkodie, S. A. (2019). Contemporaneous interaction between energy consumption, economic growth and environmental sustainability in South Africa: what drives what? Science of the total environment, 686, 468-475. <doi.org/10.1016/j.scitotenv.2019.05.421>.
[15] Musibau, H. O., Shittu, W. O., Ogunlana, F. O. (2021). The relationship between environmental degradation, energy use and economic growth in Nigeria: new evidence from non-linear ARDL. International Journal of Energy Sector Management, 15(1), 81-100. <doi.org/10.1108/IJESM-04-2019-0016>.
[16] Erdogan, S., Okumus, I., Guzel, A. E. (2020). Revisiting the Environmental Kuznets Curve hypothesis in OECD countries: the role of renewable, non-renewable energy, and oil prices. Environmental Science and Pollution Research, 27(19), 23655-23663. <doi.org/10.1007/s11356-020-08520-x>.
[17] Koc, S., Bulus, G. C. (2020). Testing validity of the EKC hypothesis in South Korea: role of renewable energy and trade openness. Environmental Science and Pollution Research, 27(23), 29043-29054. <doi.org/10.1007/s11356-020-09172-7>.
[18] Sreenu, N. (2022). Impact of FDI, crude oil price and economic growth on CO2 emission in India: -symmetric and asymmetric analysis through ARDL and non-linear ARDL approach. Environmental Science and Pollution Research, 29(28), 42452-42465. <doi.org/10.1007/s11356-022-19597-x>.
[19] Çakmak, E. E., Acar, S. (2022). The nexus between economic growth, renewable energy and ecological footprint: An empirical evidence from most oil-producing countries. Journal of Cleaner Production, 352, 131548. <doi.org/10.1016/j.jclepro.2022.131548>.
[20] Feng, Y., Zhao, T. (2022). Exploring the nonlinear relationship between renewable energy consumption and economic growth in the context of global climate change. International Journal of Environmental Research and Public Health, 19(23), 15647. <doi.org/10.3390/ijerph192315647>.
[21] Ullah, A., Ahmed, M., Raza, S. A., Ali, S. (2021). A threshold approach to sustainable development: nonlinear relationship between renewable energy consumption, natural resource rent, and ecological footprint. Journal of environmental management, 295, 113073. <doi.org/10.1016/j.jenvman.2021.113073>.
[22] Ali, A., Radulescu, M., Balsalobre-Lorente, D. (2023). A dynamic relationship between renewable energy consumption, nonrenewable energy consumption, economic growth, and carbon dioxide emissions: Evidence from Asian emerging economies. Energy & Environment, 34(8), 3529-3552. <doi.org/10.1177/0958305X231151684>.
[23] Erdoğan, E., Serin Oktay, D., Manga, M., Bal, H., Algan, N. (2024). Examining the effects of renewable energy and economic growth on carbon emission in Canada: Evidence from the nonlinear ARDL approaches. Evaluation Review, 48(1), 63-89. <doi.org/10.1177/0193841X231166973>.
[24] Toumi, S., Toumi, H. (2019). Asymmetric causality among renewable energy consumption, CO2 emissions, and economic growth in KSA: evidence from a non-linear ARDL model. Environmental Science and Pollution Research, 26(16), 16145-16156. <doi.org/10.1007/s11356-019-04955-z>.
[25] Baz, K., Xu, D., Ali, H., Ali, I., Khan, I., Khan, M. M., Cheng, J. (2020). Asymmetric impact of energy consumption and economic growth on ecological footprint: using asymmetric and nonlinear approach. Science of the total environment, 718, 137364. <doi.org/10.1016/j.scitotenv.2020.137364>.
[26] Elbadri, M., Bsikre, S., Alamari, O., Balcilar, M. (2023, August). Nexus between renewable energy consumption, economic growth, and CO2 emissions in Algeria: New evidence from the Fourier‐Bootstrap ARDL approach. In Natural Resources Forum, Oxford, UK: Blackwell Publishing Ltd., Vol. 47, No. 3, 393-412. <doi.org/10.1111/1477-8947.12292>.
[27] Brini, R., Amara, M., Jemmali, H. (2017). Renewable energy consumption, international trade, oil price and economic growth inter-linkages: The case of Tunisia. Renewable and Sustainable Energy Reviews, 76, 620-627. <doi.org/10.1016/j.rser.2017.03.067>.
[28] Gülcü, A. (2025). Essays on financialization, income inequality and growth. <hdl.handle.net/11511/114100>.
[29] Georgescu, I., Kinnunen, J. (2025). Nonlinear Effects of GDP Regimes, Renewable Energy, and Urbanization on Finland’s Ecological Footprint: An MT-NARDL Approach. World Development Sustainability, 100235. <doi.org/10.1016/j.wds.2025.100235>.
Downloads
Downloads
Published
Issue
Section
License

This work is licensed under a Creative Commons Attribution-ShareAlike 4.0 International License.
How to Cite
Share