
When Debt Overtakes Spending: A Partial Wavelet Coherence Analysis of Fiscal Policy and Economic Growth in France (1990–2024)
DOI:
https://doi.org/10.35945/gb.2026.21.012Keywords:
Wavelet partial analysis, fiscal policy, public debt, public expenditure, FranceAbstract
This study investigates the dynamic relationships among public expenditure, public debt, and economic growth in France over the 1990–2024 period using wavelet coherence (WTC), partial wavelet coherence (PWC), and Granger causality analysis. This multi-method approach allows fiscal-macroeconomic linkages to be assessed simultaneously across time and frequency, capturing structural shifts that conventional econometric methods cannot detect. Results show that fiscal-macroeconomic associations operate predominantly at business cycle frequencies and strengthen markedly following eurozone integration and the 2008 financial crisis. Sub-period analysis reveals a clear structural transformation in France’s fiscal regime. Before EMU, public spending maintained a stronger conditional association with growth than public debt, consistent with expenditure-led stabilization under monetary sovereignty. After 1999, this pattern reverses. Post-2008, the divergence widens further as debt levels exceed 110% of GDP. Granger causality tests confirm bidirectional feedback between fiscal instruments and growth, alongside strong unidirectional causality running from expenditure to debt. These findings suggest that France has transitioned from a fiscal regime driven by public spending to one increasingly constrained by accumulated debt, with direct implications for consolidation strategy and medium-term budgetary design within the eurozone framework.
Keywords: Wavelet partial analysis, fiscal policy, public debt, public expenditure, France.
Introduction
The relationship between fiscal policy and economic growth is one of the most persistent debates in macroeconomics, traditionally opposing Keynesian and neoclassical perspectives. While the Keynesian approach emphasizes the effectiveness of public spending in stimulating aggregate demand, particularly during recessions, the neoclassical approach highlights the negative effects of public debt accumulation via fiscal expectations, sovereign risk premiums, and the crowding out of private investment. However, most of the existing empirical literature treats these two dimensions of fiscal policy separately, neglecting their complex interactions and potentially distinct transmission mechanisms. Over the past three decades, France has experienced persistent fiscal imbalances, with public spending among the highest in the OECD, around 55–58% of GDP,[1] and debt levels exceeding 100% of GDP after the COVID-19 crisis, 113% in the fourth quarter of 2024.[2] In addition, membership in the European Monetary Union eliminates national monetary policy autonomy, which further complicates the management of France’s fiscal policy. This has reignited debates about the growth impact of fiscal expansion and the risks of excessive indebtedness. Yet, the channels through which fiscal policy influences growth, directly through public investment and consumption, or indirectly through debt accumulation and financial constraints, remain complex. Traditional econometric methods often fail to disentangle these dynamic interactions across time and frequency. By employing wavelet coherence and partial wavelet coherence, this study offers a nuanced exploration of how fiscal instruments transmit their effects on growth at both short-term and long-term horizons. Such an approach provides valuable insights for policymakers seeking to balance fiscal discipline with economic stimulus and to ensure the long-term sustainability of France’s public finances while supporting economic performance.
This research offers both a methodological and empirical contribution by systematically examining the time-varying and frequency-dependent co-movement between fiscal policy variables and economic growth through an innovative approach that combines Wavelet Total Coherence (WTC), Partial Wavelet Coherence (PWC), and Granger causality analysis. This methodology addresses three fundamental questions often ignored in the conventional literature: First, to what extent does public debt co-move with economic growth independently of public expenditure dynamics? Second, do public expenditures exhibit distinct co-movement with growth beyond the debt accumulation they generate? Third, is the observed relationship between public debt and government expenditure mainly driven by underlying structural fiscal constraints, or does it reflect a shared response to fluctuations in economic growth? By applying this methodology to France over the period 1990–2024, we obtain a particularly relevant case study. This context allows for an examination of fiscal transmission co-movements in a setting where fiscal policy serves as the main instrument of macroeconomic stabilization, while being constrained by European rules (the Maastricht criteria and the Stability and Growth Pact). The article is organized as follows: Section 1 presents the literature review and theoretical positioning. Section 2 describes the classical and partial wavelet coherence methodology. Section 3 presents the data and empirical specifications. Section 4 presents the main results. Section 5 discusses the theoretical and policy implications. Section 6 highlights the research limitations, followed by the conclusion.
1. Literature Review
1.1. Public debt and growth: The theoretical debate
The relationship between public debt and economic growth has generated abundant and controversial literature. The neo-Ricardian perspective, initiated by Barro,[3] posits that rational economic agents anticipate that public debt accumulation will require future tax increases, leading them to increase precautionary savings and reduce current consumption, thus neutralizing the expansionary effects of debt-financed spending. Although strict Ricardian equivalence is largely rejected empirically, it underscores the importance of expectations and intertemporal constraints in fiscal policy transmission. Recent empirical work has identified several channels through which high levels of public debt can negatively affect growth. Reinhart and Rogoff[4] published their influential paper “Growth in a Time of Debt” in The American Economic Review, arguing that when government debt exceeds 90% of GDP, average growth falls considerably. Their analysis was based on data from 44 countries spanning about 200 years. However, Herndon et al. [5]published a critique identifying coding errors, selective exclusion of available data, and unconventional weighting of summary statistics. After correcting these errors, they found that countries with public debt/GDP ratios above 90% averaged 2.2% real annual GDP growth, not -0.1% as originally published. More robustly, Checherita-Westphal and Rother[6] identify a negative impact of debt on growth beyond 90-100% of GDP for European countries, operating through three main channels: increasing long-term interest rates, crowding out private investment, and reducing total factor productivity. Égert[7] confirms these non-linear effects while emphasizing their dependence on the economy’s cyclical position. Corsetti et al.[8] analyze the confidence channel during the European sovereign debt crisis, showing how loss of confidence in fiscal sustainability can trigger self-fulfilling prophecies and multiple equilibria. Afonso and de Sá Fortes Leitão Rodrigues[9] examined the relationship between public debt, governance, and economic growth. Their study of 44 developing countries from 1990-2000 shows that public debt impedes economic growth in all quantiles. However, in the presence of good governance, public debt promotes economic growth in the medium to higher quantiles. The empirical findings confirm that governance is far more important in promoting economic growth.
1.2. Public expenditure and growth: Keynesian effectiveness
The literature on public expenditure effects on growth has developed considerably since the 2008 financial crisis, renewing interest in Keynesian fiscal multipliers. Blanchard and Perotti[10] established a benchmark methodology using impulse response functions in a structural VAR framework, estimating public expenditure multipliers around 1.5 after four quarters for the United States. A major recent development concerns the cyclical dependence of fiscal multipliers. Auerbach and Gorodnichenko[11] demonstrate that multipliers can be two to three times higher during recessions than in expansion periods, a result confirmed by Batini et al.[12] for a panel of advanced countries. This asymmetry is explained by the presence of unused productive capacity during recessions, reducing crowding-out effects on private demand, and by the prevalence of credit constraints affecting households and firms during periods of financial stress. This methodological controversy illustrates the sensitivity of estimates to identification assumptions and measurement of fiscal shocks. The composition of public expenditure also appears crucial. Arestis et al. (2020)[13] provide empirical evidence on the linkage between government expenditure and output using the Keynesian view versus Wagner’s law, demonstrating the importance of government expenditure in stimulating economic growth. Recent research using panel ARDL approaches for European Union countries shows that different categories of public expenditures have dissimilar long- and short-term effects on economic performance. Oyadeyi[14] found that in ECOWAS countries, government expenditure positively influences real GDP, with findings indicating that the response of economic growth to government spending shocks differs according to the nature of shocks. At the disaggregated level, Nguyen and Bui[15] collected data from 16 emerging and developing economies and showed that government expenditure negatively impacts economic growth in the long run. Their study suggests that public sector consumption does not promote economic growth, while several studies have found a positive correlation between economic growth and educational indicators or expenditures. France presents a particularly instructive case study for examining the composition and efficiency of public expenditure. Afonso et al.[16] examined public spending efficiency in France using historical data from 1870-2010 and found that the only functional component of expenditure that clearly contributes to the growth of French output is expenditure aimed at the protection of property rights. Public interventions in support of the economy, on the other hand, have no impact on growth. In the area of social spending, only health expenditure contributes to output growth, while education spending shows insignificant effects. These findings provide empirical support for Smith’s minimal state hypothesis in the French context: the restriction of the size of the state and the delimitation to its essential functions tend to favor output growth. This contrasts with the more general findings in developing countries, where education expenditure typically shows positive growth effects.
1.3. Debt-expenditure interactions: A neglected dimension
Despite abundant literature on the separate effects of debt and expenditure, few studies systematically examine their interactions and the decomposition of their respective effects. Most studies control for one variable when analyzing the other, but without explicit decomposition of direct and indirect effects. Ilzetzki et al.[17] represent a notable exception, examining how public expenditure effectiveness varies according to pre-existing debt levels. They find that fiscal multipliers are significantly lower in countries with high debt-to-GDP ratios, suggesting a negative interaction between debt level and expenditure effectiveness. Huidrom et al.[18] confirm this result and show that this interaction operates primarily through the confidence channel and expectations of fiscal sustainability. Nguyen and Trinh[19] examined fiscal standards using panel data from 92 countries from 2000 to 2021, showing that fiscal standards decrease the adverse effects of fiscal rules on output growth, demonstrating a trade-off between public debt sustainability and output growth. However, these works mainly treat debt level as a conditional variable moderating expenditure effect, rather than as exerting autonomous effects that must be analytically distinguished. Our partial wavelet coherence approach precisely enables this conditional co-movement analysis, revealing the time-frequency structure of fiscal relationships.
2. Methodology and Data
This section first outlines the wavelet analysis methodology applied in the study and then presents the dataset used for the empirical investigation
2.1. Analytical framework
This study employs wavelet-based time-frequency analysis to examine the dynamic relationships among economic growth and fiscal policy in France. Unlike conventional time-series methods that assume stationarity and time-invariant correlations, wavelet techniques decompose relationships across both time and frequency domains, revealing how co-movements evolve at different periodicities (short-term fluctuations vs. long-term trends) and across different historical episodes (crisis vs. stable periods). Our methodological approach proceeds in four stages: (1) preliminary stationarity testing and data transformation, (2) bivariate wavelet coherence (WTC) to identify pairwise co-movements, (3) partial wavelet coherence (PWC) to isolate conditional relationships from third-variable confounding, and (4) Granger causality tests to establish temporal precedence. This multi-method triangulation strengthens the empirical evidence beyond what any single technique can provide. Since our data are quarterly, each wavelet period corresponds to one quarter; thus, 2-4 periods represent 6 months to 1 year (short-run), 8-16 periods represent 2 to 4 years (medium-run), and 16-32 periods represent 4 to 8 years (long-run). These conversions are applied consistently throughout the interpretation of all wavelet coherence figures.
2.2. Wavelet coherence
The wavelet coherence framework, originally developed by Goupillaud et al.,[20] enables the examination of causal relationships between two variables simultaneously across both the time and frequency domains. Wavelet total coherence measures local correlation between two time series x(t) and y(t) in the time-frequency domain. It generalizes the concept of cross-correlation by allowing this correlation to vary both in time and according to the considered frequencies (or periods). The continuous wavelet transform (CWT) decomposes a time series into time-frequency space by convolving the data with scaled and translated versions of a mother wavelet function. For a discrete time series x(t) with uniform time steps δt and length N, the CWT is defined as:
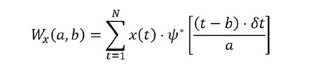
where:
- Wx(a,b) denotes the wavelet coefficient at scale a and time position b
- ψ(t) represents the mother wavelet function
- ψ∗(t) is the complex conjugate of the mother wavelet
- a is the wavelet scale (inversely related to frequency)
- b is the translation parameter (time localization)
This study employs the Morlet wavelet as the mother wavelet function, following the standard practice in economic and financial applications (Aguiar-Conraria & Soares, 2014; Rua & Nunes, 2009).[21] The Morlet wavelet is defined as:

The Morlet wavelet is particularly advantageous for economic applications because: It provides excellent frequency resolution, crucial for distinguishing business cycle frequencies; Its Gaussian envelope ensures good time localization for identifying structural breaks; It is complex-valued, enabling extraction of both amplitude and phase information To examine the co-movement between two time series, we construct the cross-wavelet transform, which identifies regions in time-frequency space where the two series exhibit high common power. For two time series x(t) and y(t)with wavelet transforms Wx(a,b) and Wy(a,b), the cross-wavelet transform is defined as:

where Wy∗(a,b) denotes the complex conjugate of Wy(a,b)
The cross-wavelet power spectrum is then:

This measure quantifies the local covariance between the two series at each time-frequency location. High cross-wavelet power indicates that both series exhibit large-amplitude oscillations at that particular scale and time, suggesting potential interaction or common driving forces. However, cross-wavelet power is influenced by the individual power spectra of each series; regions of high cross-wavelet power may simply reflect periods where both series have high variance, rather than genuine co-movement. To address the limitation of cross-wavelet power’s dependence on individual variances, we employ wavelet coherence, which normalizes the cross-wavelet spectrum by the power spectra of the individual series. This normalization produces a measure analogous to the squared correlation coefficient, bounded between 0 and 1, facilitating interpretation.
The wavelet coherence between two time series x(t) and y(t) is defined as:
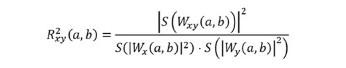
where S denotes a smoothing operator applied in both time and scale dimensions. The smoothing operator S is essential to obtain a consistent estimator of coherence. Without smoothing, the coherence would trivially equal unity at all time-frequency locations. Following Torrence and Compo,[22] we apply smoothing in both the time direction (along the time axis at each scale) and the scale direction (across adjacent scales at each time point).
2.3. Partial Wavelet Coherence (PWC)
Partial wavelet coherence extends the bivariate coherence framework to account for the confounding influence of a third variable, enabling the isolation of conditional co-movement from third-variable confounding. This multivariate extension is crucial for disentangling the complex co-movement patterns among fiscal policy variables. The concept of partial wavelet coherence is analogous to partial correlation in classical statistics but is implemented in the time-frequency domain. For three time series x(t), y(t), and z(t), the partial coherence between x and y controlling for z measures the strength of the conditional x-y relationship after removing the components of their co-movement attributable to their mutual relationships with z. Following Mihanović et al.[23] and Ng & Chan,[24] the squared partial wavelet coherence is computed in the frequency domain to preserve time-frequency localization:
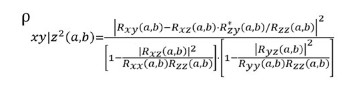
Equivalently, this can be expressed in terms of the normalized coherence measures:
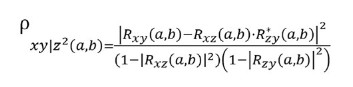
where:
- Rxy(a,b), Rxz(a,b), Ryz(a,b) are the smoothed wavelet coherence measures between pairs of variables
- Rzy∗(a,b) is the complex conjugate of Rzy(a,b)
- All coherence measures are computed at the same scale a and time position b.
The partial wavelet coherence ρxy∣z2(a,b) ranges from 0 to 1, with the same interpretation as classical wavelet coherence: Values near 0: No conditional co-movement between x and y after controlling for z. Values near 1: Strong conditional co-movement independent of z. The frequency-domain formulation employed here removes the influence of z separately at each time-frequency location, allowing the confounding effect to vary across both time and frequency. This is essential for fiscal policy analysis, where the role of control variables (e.g., debt dynamics) may be negligible at high frequencies (short-term fluctuations) but dominant at low frequencies (long-term trends), and these patterns may shift over time as policy regimes change. We compute partial wavelet coherence using the pwtc() function from the biwavelet package (version 0.20.21) in R,[25] which implements the frequency-domain methodology described above. Statistical significance is assessed using Monte Carlo simulations with 1000 randomized surrogates, analogous to the procedure for classical wavelet coherence.
3. Data and Empirical Specifications
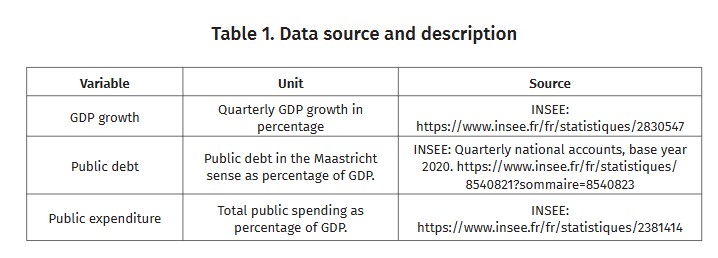
We use French quarterly data from 1990Q1 to 2024Q4, totaling 140 observations. This period covers several major economic cycles and macroeconomic shocks: the early 1990s recession, preparation for European monetary union (1992-1998), the global financial crisis (2008-2009), the European sovereign debt crisis (2010-2012), and the COVID-19 pandemic (2020-2021).
Descriptive statistics reveal that French GDP growth averaged 0.4% per quarter over 1990–2024, with high volatility and extreme leptokurtosis (kurtosis = 52.56), driven by unprecedented shocks such as the COVID-19 collapse in Q2 2020 (-12.19%) and its subsequent rebound (+15.36%). Public debt rose sharply from 36% to 117% of GDP, accelerating after 2008 and again during the pandemic, while public expenditure remained relatively stable around 55% of GDP - a divergence that points to a chronic structural deficit where revenues persistently fall short of spending. Simple linear correlations between GDP growth and either debt (-0.009) or expenditure (-0.11) are negligible, whereas the strong debt-expenditure correlation (0.79) reflects the government budget constraint; these weak pairwise correlations motivate the use of wavelet analysis, which is better suited to capturing the non-linear and non-stationary relationships that classical methods cannot detect. Finally, Variance Inflation Factors of 2.65 for both debt and expenditure confirm the absence of problematic multicollinearity, validating the reliability of the subsequent partial coherence analysis.
4. Empirical Results
4.1. Stationarity tests results
The following table indicates the stationarity test results. The three tests: ADF, PP, and KPSS results are highlighted in Table 5.
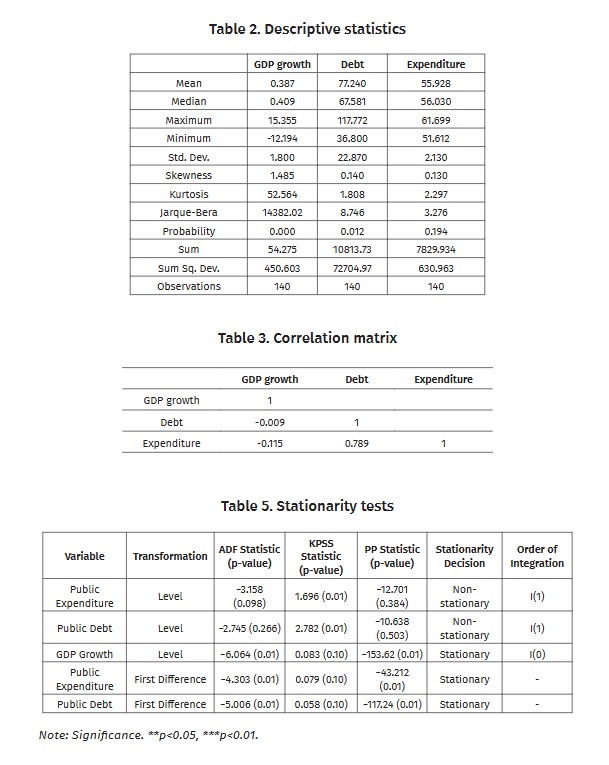
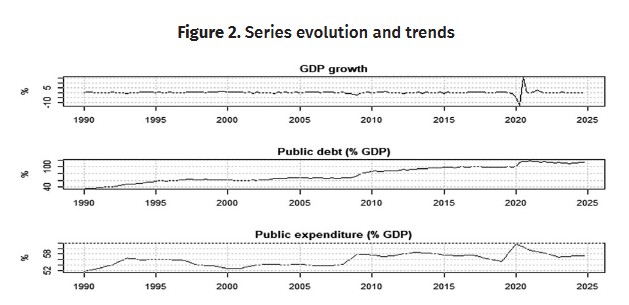
The unit root tests indicate that public expenditure and public debt are non-stationary in levels but become stationary after first differencing, implying that both variables are integrated of order one, I(1). In contrast, GDP growth is stationary in levels, suggesting an I(0) process. Figure 3 indicates the trends of the two variables after the first-difference transformation.
4.2. Wavelet analysis results
4.2.1. Debt – GDP growth relationship
4.2.1.1 Total coherence (WTC)
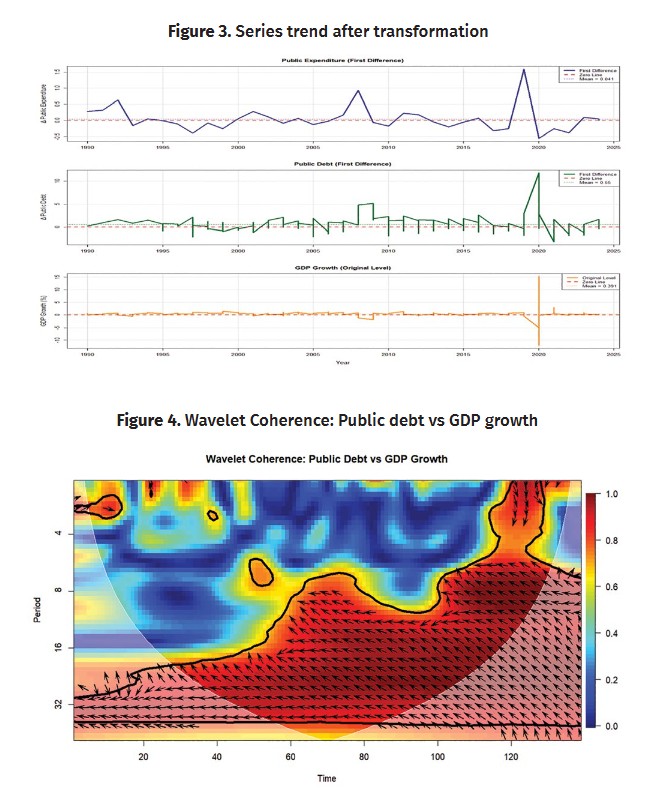
Figure 4 shows that wavelet coherence between public debt and GDP growth is largely concentrated at medium- to long-run horizons (8–32 periods), with persistently strong co-movement emerging especially from the mid-sample onward, while short-run coherence (2–4 periods) remains sporadic. Phase arrows in significant long-run regions predominantly point left and slightly downward, suggesting that rises in public debt tend to precede declines in GDP growth, consistent with debt overhang and crowding-out hypotheses, while some medium-run intervals show left-upward arrows, indicating episodes of countercyclical fiscal responses where growth slowdowns lead to debt increases. Overall, the debt-growth nexus appears time-varying and frequency-dependent, with debt leading growth at lower frequencies during much of the post-2000 period, though these patterns are suggestive rather than formally conclusive of a structural causal relationship.
4.2.1.2. Partial coherence (PWC) controlling for expenditure
The Partial Wavelet Coherence (PWC) between GDP growth and public debt, after controlling for public expenditure, reveals interesting results:
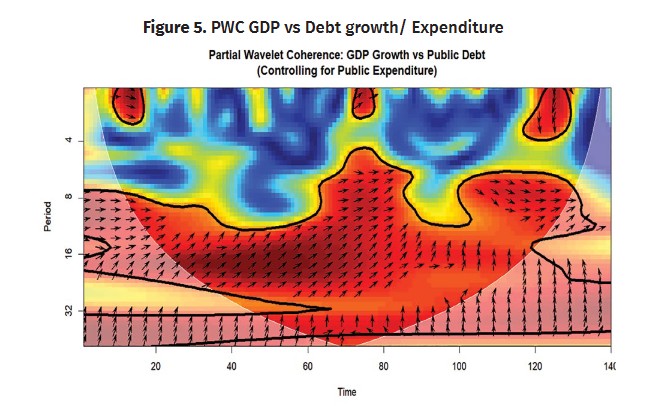
This partial wavelet coherence analysis isolates the direct relationship between French GDP growth and public debt while controlling for public expenditure effects. The analysis reveals significant coherence concentrated primarily in the medium to long-term frequency bands (8-32 periods) between approximately time points 60-120. This region of high coherence (red-orange zones with values approaching 0.8-1.0) indicates that during this critical period-roughly corresponding to France’s eurozone consolidation and crisis years- public debt and GDP growth exhibited strong co-movement at business cycle frequencies. The phase arrows point predominantly rightward and slightly upward, suggesting a positive relationship where debt dynamics and growth are synchronized, though with potential lead-lag effects. For France specifically, this pattern reflects the country’s challenging fiscal trajectory within the eurozone framework. The strong coherence in the 60–120-time window likely captures France’s experience during the European sovereign debt crisis and subsequent recovery, when rising French public debt (climbing from around 65% to over 100% of GDP) became increasingly intertwined with growth outcomes through confidence channels, sovereign risk premia, and constraints on policy flexibility. The isolated eras of coherence at shorter periods (4-8 range) around time points 10-30 suggest episodes during France’s early EMU years when debt and growth synchronized at higher frequencies, possibly reflecting adjustment dynamics as France adapted to single currency constraints and Stability and Growth Pact requirements. The relatively weak coherence at very short periods indicates that quarterly fluctuations in French debt and growth do not strongly correlate, while diminishing coherence at very long periods suggests secular trends may diverge. The concentration of coherence at business cycle frequencies has important implications for French fiscal policy: debt management strategies should focus on medium-term horizons (2-8 years) where the debt-growth nexus is strongest, rather than expecting immediate short-term effects or relying exclusively on long-term projections.
4.2.2. Expenditure-GDP relationship
4.2.2.1. Wavelet total coherence (WTC)
The following plot shows the time frequency dependency between GDP growth and public expenditure. Several consistent patterns emerge:
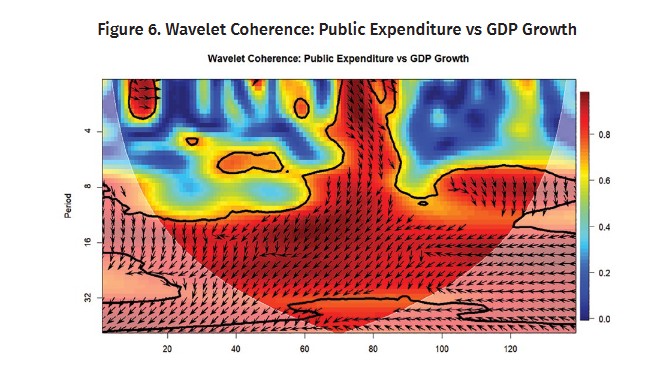
The bivariate wavelet coherence (Figure 6) reveals substantial co-movement between public expenditure and GDP growth, particularly at medium- to long-term frequencies (8-32 years). The widespread red-orange regions, enclosed by thick black contours indicating statistical significance at the 5% level, demonstrate persistent high coherence throughout most of the sample period, especially in the 16-32-year frequency band. The phase arrows, predominantly pointing rightward and downward, suggest that public expenditure leads GDP growth by approximately one quarter of the cycle, indicating a pro-cyclical or potentially counter-cyclical fiscal stance depending on the specific time window. This strong bivariate relationship supports the conventional Keynesian view that fiscal policy exerts meaningful effects on economic activity across multiple time horizons.
4.2.2.2 Partial coherence (PWC) controlling for debt
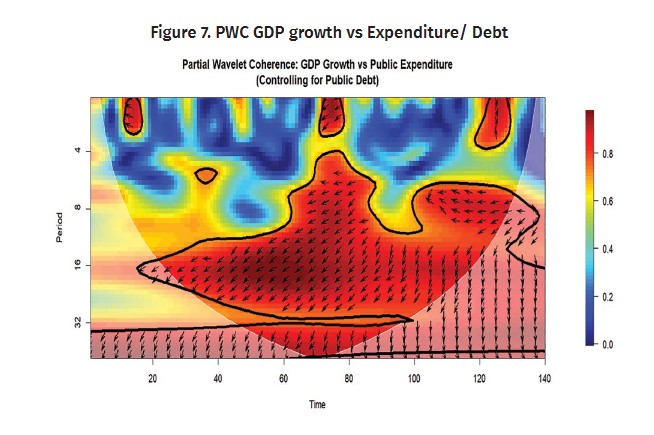
Figure 7 examines the coherence between French GDP growth and public expenditure while controlling for debt effects. Strong coherence appears in the 8-32 period bands during the 60–120 time window, similar to the debt analysis, but with notable differences in spatial distribution and intensity. The high coherence region appears more concentrated around the 16-period band and extends with somewhat different temporal dynamics, suggesting that public expenditure’s relationship with GDP growth operates through partially distinct frequency channels compared to debt. For France, this pattern reflects the country’s historically strong reliance on public expenditure as an economic management tool. With government spending at approximately 57% of GDP, France maintains one of the world’s largest public sectors. The coherence at business cycle frequencies confirms that French public spending, encompassing extensive social protection, public services, and state intervention, maintains significant synchronization with growth outcomes over medium-term horizons. The phase relationships show predominantly positive associations with more immediate effects compared to debt, consistent with expenditure having direct demand-side impacts through government consumption, investment, and transfers. However, the visual coherence patterns indicate that while expenditure and growth remain connected, the strength of this connection when controlling for debt has diminished, reflecting France’s fiscal policy dilemma: high debt levels now constrain the effectiveness of the expenditure activism that historically defined French economic policy. The scattered islands of short-term coherence may correspond to specific fiscal interventions or crisis responses where spending had more immediate growth effects.
4.2.3. Expenditure-debt relationship
4.2.3.1 Wavelet Total Coherence (WTC)
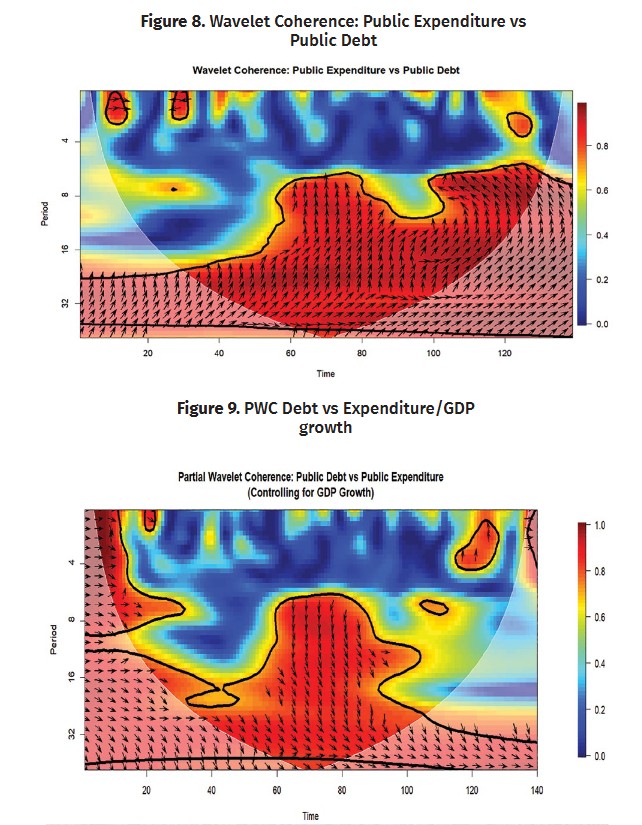
Figure 8 shows that public expenditure and public debt are strongly and persistently synchronized at medium- to long-term horizons (8-32 periods), while their short-run relationship remains weak and intermittent. This means temporary spending fluctuations do not immediately affect debt, but sustained spending patterns are a key driver of debt accumulation over time. Phase arrows predominantly point right and upward, indicating that spending increases tend to precede and cause rises in public debt, consistent with standard deficit-financing logic. In some sub-periods, arrows tilt slightly downward, hinting at occasional feedback where high debt levels begin to constrain expenditure decisions, likely through consolidation pressures or rising debt-servicing costs.
4.2.3.2 Partial coherence (PWC) controlling for GDP
Figure 9 presents the partial wavelet coherence between public expenditure and public debt after controlling for GDP growth
Figure 9 shows that French public debt and public expenditure have moved closely together across most time periods and frequencies, even after removing the influence of GDP growth. The strongest synchronization appears at medium-term horizons (8-32 periods), reflecting coordinated fiscal management where borrowing has consistently financed spending commitments, not just crisis-driven stimulus, but also France’s structural social and public service obligations. Early in the sample, tight short-term coupling reflects the pressure of meeting Maastricht criteria, though France repeatedly fell short. Phase arrows indicate that debt tends to slightly lead expenditure, with both moving in the same direction. However, the relatively low post-crisis partial coherence value (0.21) reveals that much of this co-movement is actually driven by shared reactions to growth fluctuations rather than independent fiscal decisions, suggesting that France’s fiscal policy has become more reactive than proactive in recent years.
4.3. Robustness checks (pre-EMU vs post-EMU; pre-2008 vs post-2008)
Table 6 reports the average Wavelet Coherence (WTC) and Partial Wavelet Coherence (PWC) estimates between GDP growth, public debt, and public expenditure across different institutional and macroeconomic regimes.
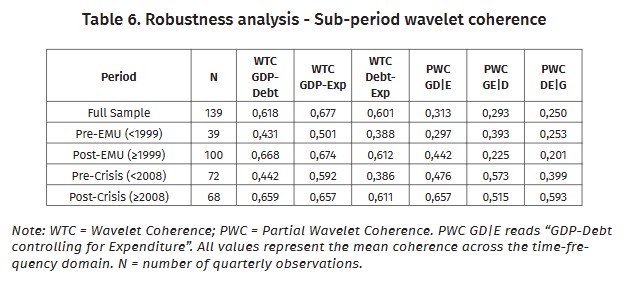
Table 6 reports wavelet coherence (WTC) and partial wavelet coherence (PWC) estimates for the three variable pairs: GDP growth, public debt, and public expenditure, across four sub-periods. Full sample: Over the entire 1990–2024 period, all three variable pairs display strong bivariate coherence: GDP-Expenditure leads at 0.677, followed by GDP-Debt (0.618) and Debt-Expenditure (0.601). These high values are unsurprising given France’s large public sector, where government spending represents around 57% of GDP. Once the influence of the third variable is controlled for, however, partial coherence values fall to the 0.25, 0.29, 0.31 range, indicating that a substantial share of the observed pairwise associations reflects common exposure to fiscal dynamics rather than direct bilateral linkages. Pre-EMU period (before 1999): All coherence measures are at their weakest in this sub-period. The GDP-Expenditure association (0.501) exceeds that of GDP-Debt (0.431), in line with France’s traditional reliance on public spending as its main macroeconomic instrument under full monetary sovereignty. Notably, the conditional expenditure-growth estimate (PWC GE|D = 0.393) remains relatively high, confirming that public spending exerted a meaningful independent influence on growth before the constraints of eurozone membership applied. This indicates that expenditure maintained strong conditional co-movement with growth when France had fiscal autonomy. Post-EMU period (1999 onward): Euro adoption is accompanied by a broad strengthening of all coherence measures: GDP-Debt rises to 0.668, GDP-Expenditure to 0.674, and Debt-Expenditure to 0.612. At the conditional level, the debt-growth estimate (PWC GD|E) increases to 0.442 while the expenditure-growth estimate (PWC GE|D) falls to 0.225. This shift suggests that, under eurozone fiscal rules, debt accumulation gradually took over the role that public spending had previously played in driving growth fluctuations.
Pre-crisis period (before 2008): The WTC GDP-Debt measure (0.442) is lower in this sub-period than in either of the post-EMU or post-crisis windows, though the absolute minimum across all sub-periods belongs to the Pre-EMU era (0.431). More notable is the PWC GE|D, which reaches 0.573 - its highest value across all sub-periods. This suggests that French public spending maintained its closest association with growth during the relatively calm years of early eurozone membership, a finding that sits in stark contrast with France’s repeated violations of Stability and Growth Pact deficit limits during the same period. Post-crisis period (2008 onward): All coherence measures reach their sample-period highs: WTC GDP-Debt at 0.659, WTC GDP-Expenditure at 0.657, and WTC Debt-Expenditure at 0.611. This broad tightening reflects France's large-scale fiscal response to the 2008 crisis and the subsequent build-up of public debt above 110% of GDP. At the conditional level, PWC GD|E rises to 0.657 while PWC GE|D declines to 0.515, down from its pre-crisis peak of 0.573. Taken together, these results point to a clear structural shift: as debt accumulated, its association with growth strengthened while the expenditure-growth link weakened. France appears to have moved from a fiscal regime in which public spending was the primary growth driver to one in which the level of accumulated debt defines the main constraint on macroeconomic performance.
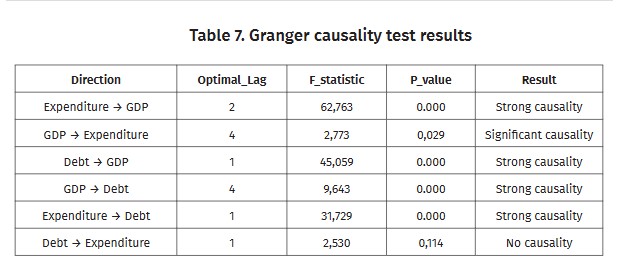
4.4. Granger causality test results
Granger causality tests complement our wavelet coherence analysis by identifying temporal precedence relationships. We find bidirectional causality between GDP and debt, confirming the dynamic feedback loop between the two variables. We notice from Table 7 a strong causality between Expenditure and GDP (p value=0.0000), the relationship between GDP and Expenditure is also significant, confirming the bidirectional causality between the two variables. Expenditure exhibits strong unidirectional causality toward debt. The absence of a debt-to- expenditure feedback mechanism represents a critical vulnerability in France’s fiscal framework, as the budget constraint operates unidirectionally without self-correcting properties.
5. Policy Implication
The wavelet analysis points to four practical lessons for French fiscal policy. First, public spending takes time to affect growth, so short-term budget tweaks are unlikely to work; longer-term planning is needed instead. Second, since the 2008 crisis, debt has become more damaging to growth while spending has become less effective at boosting it, largely because high debt raises borrowing costs and scares off private investment. Third, France’s spending decisions have historically driven debt upward without any automatic correction mechanism, which is exactly the kind of imbalance the EU’s new fiscal rules are trying to fix. Fourth, public spending was a much more powerful growth tool when debt was below 70% of GDP, so reducing debt gradually is not just an external constraint; it is the only way to make fiscal policy effective again.
Research Limitation
The study has a few limitations worth noting. It only looks at France, leaving open the question of whether these findings apply elsewhere. The data themselves carry measurement uncertainty, and important factors like interest rates and monetary policy are not included in the model. The extreme COVID shock of 2020 also creates some technical noise near the edges of the wavelet analysis. Future work could consider robustness checks excluding the 2020–2021 period or employing adaptive wavelet methods designed to handle structural outliers.
Conclusion
This paper has applied a combination of Partial Wavelet Coherence and Granger causality tests to examine the complex frequency-dependent associations among fiscal policy variables and economic growth. Applied to French quarterly data spanning 1990-2024, our methodology reveals that France’s fiscal co-movement patterns operate primarily at business cycle frequencies and have shifted notably following eurozone integration in 1999 and the 2008–2012 crisis period. The main finding of this study points to a clear shift in how fiscal policy operates in France. Before the euro, public spending was closely associated with economic growth, giving the government an effective lever to steer the economy. Today, this relationship has weakened, while the link between public debt and growth has grown stronger, meaning that the level of accumulated debt now shapes economic outcomes more than spending decisions themselves.
References:
Afonso, A., de Sá Fortes Leitão Rodrigues, E. (2022) Corruption and economic growth: does the size of the government matter? Econ Change Restruct 55(2):543–576. <https://doi.org/10.1007/s10644-021-09338-4>;
Aguiar-Conraria, L., Soares, M. J. (2014). The continuous wavelet transforms: Moving beyond uni-and bivariate analysis. Journal of Economic Surveys, 28(2). <https://doi.org/10.1111/joes.12012>;
Arestis, P., Şen, H., Kaya, A. (2020). On the linkage between government expenditure and output: Empirics of the Keynesian view versus Wagner’s law. Economic Change and Restructuring, 54(2). <https://doi.org/10.1007/s10644-020-09284-7>;
Auerbach, A. J., Gorodnichenko, Y. (2013). Fiscal multipliers in recession and expansion. In Fiscal Policy after the Financial Crisis (pp. 63-98). University of Chicago Press. <https://doi.org/10.7208/chicago/9780226018584.003.0003>;
Barro, R. J. (1974). Are government bonds net wealth? Journal of Political Economy, 82(6). <https://doi.org/10.1086/260266>;
Batini, N., Eyraud, L., Forni, L., Weber, A. (2014). Fiscal multipliers: Size, determinants, and use in macroeconomic projections. IMF Technical Notes and Manuals, 2014/004. <https://doi.org/10.5089/9781498382458.005>;
Blanchard, O., Perotti, R. (2002). An empirical characterization of the dynamic effects of changes in government spending and taxes on output. Quarterly Journal of Economics, 117(4). <https://doi.org/10.1162/003355302320935043>;
Checherita-Westphal, C., Rother, P. (2012). The impact of high government debt on economic growth and its channels: An empirical investigation for the euro area. European Economic Review, 56(7). <https://doi.org/10.1016/j.euroecorev.2012.06.007>;
Corsetti, G., Kuester, K., Meier, A., Müller, G. J. (2013). Sovereign risk, fiscal policy, and macroeconomic stability. Economic Journal, 123(566). <https://doi.org/10.5089/9781463933180.001>;
Égert, B. (2015). Public debt, economic growth and nonlinear effects: Myth or reality? Journal of Macroeconomics, 43. <https://doi.org/10.1016/j.jmacro.2014.11.006>;
Gouhier, T. C., Grinsted, A., Jevrejeva, S. (2021). Biwavelet: Conduct Univariate and Bivariate Wavelet Analyses. R package version 0.20.21;
Goupillaud, P., Grossmann, A., Morlet, J. (1984). Cycle-octave and related transforms in seismic signal analysis. Geoexploration, 23(1). <https://doi.org/10.1016/0016-7142(84)90025-5>;
Herndon, T., Ash, M., Pollin, R. (2014). Does high public debt consistently stifle economic growth? A critique of Reinhart and Rogoff. Cambridge Journal of Economics, 38(2). <https://doi.org/10.1093/cje/bet075>;
Huidrom, R., Kose, M. A., Lim, J. J., Ohnsorge, F. L. (2020). Why do fiscal multipliers depend on fiscal positions? Journal of Monetary Economics, 114. <https://doi.10.1016/j.jmoneco.2019.03.004>;
Ilzetzki, E., Mendoza, E. G., Végh, C. A. (2013). How big (small?) are fiscal multipliers? Journal of Monetary Economics, 60(2). <https://doi.10.1016/j.jmoneco.2012.10.011>;
Insee. <https://www.insee.fr/fr/statistiques/ 8540821?sommaire=8540823>;
Mihanović, H., Orlić, M., Pasarić, Z. (2009). Diurnal thermocline oscillations driven by tidal flow around an island in the Middle Adriatic. Journal of Marine Systems, 78, S157-S168. <https://doi.org/10.1016/j.jmarsys.2009.01.021>;
Ng, E. K., Chan, J. C. (2012). Geophysical applications of partial wavelet coherence and multiple wavelet coherence. Journal of Atmospheric and Oceanic Technology, 29(12). <https://doi.org/10.1175/JTECH-D-12-00056.1>;
Nguyen, C. T., Bui, T. H. L. (2022). Government expenditure and economic growth: Does the role of corruption control matter? Heliyon, 8(10), e10822. <https://doi.org/10.1016/j.heliyon.2022.e10822>;
Nguyen, T. C., Trinh, L. T. (2021). The impact of fiscal policy on economic growth: Evidence from emerging and developing Asian countries. Economics and Business Letters, 10(3). <https://doi.org/10.17811/ebl.10.3.2021.251-262>;
OECD. (2024). OECD Economic Surveys: France. OECD Publishing. <https://doi.org/10.1787/bd96e2ed-en>;
Oyadeyi, O. O. (2024). Effect of government expenditure on real economic growth in ECOWAS: Assessing the moderating role of corruption and conflict. Humanities and Social Sciences Communications, 11. <https://doi.org/10.1057/s41599-024-03285-x>;
Reinhart, C. M., Rogoff, K. S. (2010). Growth in a time of debt. American Economic Review, 100(2). <https://doi.org/10.1257/aer.100.2.573>;
Rua, A., Nunes, L. C. (2009). International co-movement of stock market returns: A wavelet analysis. Journal of Empirical Finance, 16(4), 632-639. <https://doi.org/10.1016/j.jempfin.2009.02.002>;
Torrence, C., Compo, G. P. (1998). A Practical Guide to Wavelet Analysis. Bulletin of the American Meteorological Society, 79.
Footnotes
[1] OECD. (2024). OECD Economic Surveys: France. OECD Publishing. <https://doi.org/10.1787/bd96e2ed-en>.
[2] Insee. <https://www.insee.fr/fr/statistiques/ 8540821?sommaire=8540823>.
[3] Barro, R. J. (1974). Are government bonds net wealth? Journal of Political Economy, 82(6), 1095-1117. <https://doi.org/10.1086/260266>.
[4] Reinhart, C. M., Rogoff, K. S. (2010). Growth in a time of debt. American Economic Review, 100(2), 573-578. <https://doi.org/10.1257/aer.100.2.573>.
[5] Herndon, T., Ash, M., Pollin, R. (2014). Does high public debt consistently stifle economic growth? A critique of Reinhart and Rogoff. Cambridge Journal of Economics, 38(2), 257-279. <https://doi.org/10.1093/cje/bet075>.
[6] Checherita-Westphal, C., Rother, P. (2012). The impact of high government debt on economic growth and its channels: An empirical investigation for the euro area. European Economic Review, 56(7), 1392-1405. <https://doi.org/10.1016/j.euroecorev.2012.06.007>.
[7] Égert, B. (2015). Public debt, economic growth and nonlinear effects: Myth or reality? Journal of Macroeconomics, 43, 226-238. <https://doi.org/10.1016/j.jmacro.2014.11.006>.
[8] Corsetti, G., Kuester, K., Meier, A., Müller, G. J. (2013). Sovereign risk, fiscal policy, and macroeconomic stability. Economic Journal, 123(566), 99-132. <https://doi.org/10.5089/9781463933180.001>.
[9] Afonso, A., de Sá Fortes Leitão Rodrigues, E. (2022) Corruption and economic growth: does the size of the government matter? Econ Change Restruct 55(2):543–576. <https://doi.org/10.1007/s10644-021-09338-4>.
[10] Blanchard, O., Perotti, R. (2002). An empirical characterization of the dynamic effects of changes in government spending and taxes on output. Quarterly Journal of Economics, 117(4), 1329-1368. <https://doi.org/10.1162/003355302320935043>.
[11] Auerbach, A. J., Gorodnichenko, Y. (2013). Fiscal multipliers in recession and expansion. In Fiscal Policy after the Financial Crisis (pp. 63-98). University of Chicago Press. <https://doi.org/10.7208/chicago/9780226018584.003.0003>.
[12] Batini, N., Eyraud, L., Forni, L., Weber, A. (2014). Fiscal multipliers: Size, determinants, and use in macroeconomic projections. IMF Technical Notes and Manuals, 2014/004. <https://doi.org/10.5089/9781498382458.005>.
[13] Arestis, P., Şen, H., Kaya, A. (2020). On the linkage between government expenditure and output: Empirics of the Keynesian view versus Wagner’s law. Economic Change and Restructuring, 54(2), 265-303. <https://doi.org/10.1007/s10644-020-09284-7>.
[14] Oyadeyi, O. O. (2024). Effect of government expenditure on real economic growth in ECOWAS: Assessing the moderating role of corruption and conflict. Humanities and Social Sciences Communications, 11, 740. <https://doi.org/10.1057/s41599-024-03285-x>.
[15] Nguyen, C. T., Bui, T. H. L. (2022). Government expenditure and economic growth: Does the role of corruption control matter? Heliyon, 8(10), e10822. <https://doi.org/10.1016/j.heliyon.2022.e10822>.
[16] Op. cit.
[17] Ilzetzki, E., Mendoza, E. G., Végh, C. A. (2013). How big (small?) are fiscal multipliers? Journal of Monetary Economics, 60(2), 239-254. <https://doi.10.1016/j.jmoneco.2012.10.011>.
[18] Huidrom, R., Kose, M. A., Lim, J. J., Ohnsorge, F. L. (2020). Why do fiscal multipliers depend on fiscal positions? Journal of Monetary Economics, 114, 109-125. <https://doi.10.1016/j.jmoneco.2019.03.004>.
[19] Nguyen, T. C., Trinh, L. T. (2021). The impact of fiscal policy on economic growth: Evidence from emerging and developing Asian countries. Economics and Business Letters, 10(3), 251-262. <https://doi.org/10.17811/ebl.10.3.2021.251-262>.
[20] Goupillaud, P., Grossmann, A., Morlet, J. (1984). Cycle-octave and related transforms in seismic signal analysis. Geoexploration, 23(1), 85-102. <https://doi.org/10.1016/0016-7142(84)90025-5>.
[21] Aguiar-Conraria, L., Soares, M. J. (2014). The continuous wavelet transforms: Moving beyond uni-and bivariate analysis. Journal of Economic Surveys, 28(2), 344-375. <https://doi.org/10.1111/joes.12012>; Rua, A., Nunes, L. C. (2009). International co-movement of stock market returns: A wavelet analysis. Journal of Empirical Finance, 16(4), 632-639. <https://doi.org/10.1016/j.jempfin.2009.02.002>;
[22] Torrence, C., Compo, G. P. (1998). A Practical Guide to Wavelet Analysis. Bulletin of the American Meteorological Society, 79, 61-78.
[23] Mihanović, H., Orlić, M., Pasarić, Z. (2009). Diurnal thermocline oscillations driven by tidal flow around an island in the Middle Adriatic. Journal of Marine Systems, 78, S157-S168. <https://doi.org/10.1016/j.jmarsys.2009.01.021>.
[24] Ng, E. K., Chan, J. C. (2012). Geophysical applications of partial wavelet coherence and multiple wavelet coherence. Journal of Atmospheric and Oceanic Technology, 29(12), 1845-1853. <https://doi.org/10.1175/JTECH-D-12-00056.1>.
[25] Gouhier, T. C., Grinsted, A., Jevrejeva, S. (2021). Biwavelet: Conduct Univariate and Bivariate Wavelet Analyses. R package version 0.20.21.
Downloads

Downloads
Published
Issue
Section
License

This work is licensed under a Creative Commons Attribution-ShareAlike 4.0 International License.
How to Cite
Share