
FinTech Leapfrogging: A Comparative Analysis of Digital Payments and Cryptocurrency Adoption in Emerging and Developed Economies
DOI:
https://doi.org/10.35945/gb.2026.21.009Keywords:
FinTech leapfrogging, digital payments, cryptocurrency adoption, financial inclusion, emerging economies, developed economies, comparative analysisAbstract
This study examines whether FinTech adoption follows divergent structural pathways across emerging and developed economies, focusing on digital payments and cryptocurrency adoption. Drawing on leapfrogging theory, it develops a comparative framework linking financial infrastructure, digital payment expansion, financial inclusion, and crypto-adoption intensity. The analysis is based on a purposive sample of ten economies and combines data from Statista Market Insights, the Chainalysis Global Crypto Adoption Index, and the World Bank Global Findex Database. The findings identify two broad patterns. In developed economies, digital payment expansion primarily reflects optimisation within mature financial systems, characterised by high banking penetration, established card-based infrastructures, and convenience-driven adoption. In several emerging economies, by contrast, digital payments exhibit a more transformative role, increasingly operating as an alternative transactional infrastructure in settings marked by financial inclusion gaps and weaker institutional capacity. Cryptocurrency adoption presents a more differentiated picture. Rather than supporting a simple inverse relationship between financial exclusion and crypto uptake, the results point to multiple adoption pathways, ranging from partial substitution for incomplete financial services in some emerging markets to investment- and institution-led adoption in developed ones.
Keywords: FinTech leapfrogging, digital payments, cryptocurrency adoption, financial inclusion, emerging economies, developed economies, comparative analysis
Introduction
Digital transformation has profoundly reshaped contemporary financial systems, particularly through the expansion of digital payments and cryptocurrencies. In recent years, FinTech has moved beyond its role as a simple technological enabler to become a structural force influencing financial inclusion, consumer behaviour, and the organisation of financial intermediation. However, these developments have not unfolded uniformly across countries. In advanced economies, FinTech has largely emerged within already mature financial systems, where it tends to improve efficiency, convenience, and service delivery. In many emerging economies, by contrast, digital financial technologies have often developed in contexts characterised by weaker banking infrastructure, lower financial inclusion, and greater reliance on mobile-based solutions.
This difference makes the comparative study of FinTech adoption particularly important. The present research is significant because it examines whether digital payments and cryptocurrency adoption reflect distinct developmental pathways across emerging and developed economies. It also contributes to current debates by linking two dimensions of digital finance that are frequently analysed separately, namely payment-system transformation and cryptocurrency adoption, within a common comparative framework. In doing so, the study seeks to clarify whether FinTech in emerging markets functions merely as a tool of technological diffusion or as a mechanism of structural leapfrogging capable of compensating for institutional and infrastructural limitations.
The research gap addressed in this study lies in the limited integration of these dimensions within the existing literature. While previous studies have examined FinTech and financial inclusion, or cryptocurrency adoption, they have rarely brought together digital payment growth, financial inclusion gaps, mobile connectivity, and crypto-adoption intensity in a single comparative framework. Accordingly, this study addresses the following central research problem: to what extent does FinTech adoption follow different pathways in emerging and developed economies, and can these differences be interpreted through the lens of leapfrogging theory? In response, the study advances the hypothesis that digital payments in developed economies mainly reflect optimisation within mature financial systems, whereas in emerging economies they are more likely to reflect structural transformation. It further hypothesises that cryptocurrency adoption does not follow a single pattern, but instead reflects multiple pathways: in some emerging economies, it may operate as a partial substitute for incomplete financial services, while in developed economies, it is more closely associated with investment, institutional participation, and broader digital financial innovation.
2. Literature Review and Conceptual Framework
2.1 FinTech and financial inclusion
Financial inclusion has evolved from a narrow policy concern centered on microfinance into a broader determinant of economic participation in the digital age. It now refers not only to access to financial services, but also to the effective integration of individuals and firms into formal financial systems through affordable, accessible, and technology-enabled mechanisms.[1],[2] Empirical research increasingly links financial inclusion to economic growth, financial stability, and broader development outcomes, particularly in contexts where access to conventional banking remains uneven.[3], [4]
Within this context, FinTech represents more than a simple technological upgrade; it constitutes a structural shift in financial intermediation. By reducing transaction costs, easing information asymmetries, and expanding service delivery through digital platforms, mobile banking, and data-driven applications, FinTech can extend financial access to previously underserved groups.[5] However, its contribution to financial inclusion is not uniform across countries and depends heavily on economic context, institutional capacity, and technological readiness.
In emerging economies, FinTech often compensates for weak banking infrastructure and limited service coverage, thereby supporting broader participation in formal financial systems. Evidence from countries such as India and several sub-Saharan African economies suggests that mobile-based financial services can reduce geographic and income-based exclusion by integrating rural and low-income users into financial networks.[6], [7], [8] In developed economies, by contrast, FinTech tends to operate within already mature financial systems, where its primary role is to enhance efficiency, convenience, and user experience rather than to expand basic access.[9]
At the same time, the relationship between FinTech and financial inclusion remains constrained by several structural factors. Infrastructure deficits, regulatory uncertainty, low financial literacy, and socio-cultural barriers may limit the capacity of marginalized groups to benefit from digital financial innovation.[10], [11], [12] As a result, FinTech reshapes not only the scale but also the nature of financial inclusion. In emerging economies, adoption is often necessity-driven and linked to access, substitution, and resilience, whereas in developed markets it is more commonly convenience-driven and associated with efficiency and optimization. This distinction provides the conceptual basis for the comparative analysis developed in the following sections.
Within this context, FinTech represents more than a simple technological upgrade; it constitutes a structural shift in financial intermediation. However, its contribution to financial inclusion is not uniform across countries and depends heavily on economic context, institutional capacity, and technological readiness.
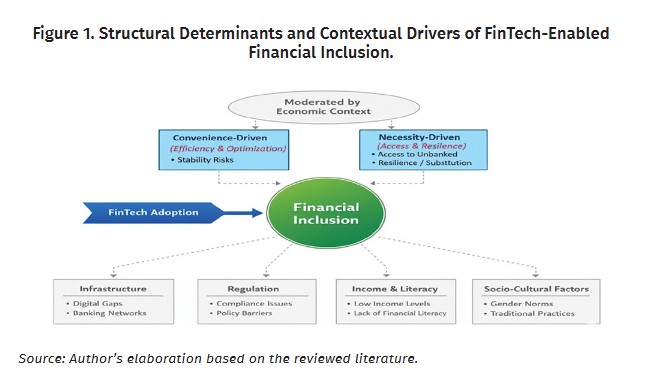
As shown in Figure 1, the impact of FinTech on financial inclusion is moderated by economic context. In emerging economies, adoption is more likely to be necessity-driven, reflecting financial access gaps and institutional deficiencies. In developed economies, by contrast, adoption tends to be convenience-driven, emphasizing efficiency and optimization within already mature financial systems.
2.2 Digital payments and structural transformation
Digital payments represent a structural change in how consumers access financial services and participate in formal economic activity. Their adoption is shaped by trust, perceived security, ease of use, convenience, and socio-cultural attitudes toward cashless transactions.[13], [14] Beyond facilitating transactions, digital payments also influence consumer behaviour by reducing transaction frictions, encouraging higher spending, and supporting the expansion of e-commerce through seamless payment processes and incentives such as cashback, discounts, and loyalty programmes.[15]
A central dimension of this transformation is financial inclusion. Digital payment systems can broaden access to formal financial services, particularly in contexts where conventional banking infrastructure remains limited. By reducing reliance on cash and lowering access barriers, they help integrate previously underserved populations into formal financial networks. At the same time, they push traditional banks to adopt FinTech solutions such as digital onboarding, biometric verification, fraud detection, and data-driven service models to remain competitive.[16], [17], [18]
However, the transformative effects of digital payments are not automatic. The digital divide, legacy banking systems, and regulatory uncertainty may constrain both adoption and impact. Accordingly, the literature suggests that digital payments should be understood not only as technological tools but also as structural mechanisms whose effectiveness depends on supportive regulation, inclusive design, and broader institutional adaptation. This perspective is especially relevant for understanding leapfrogging dynamics in emerging markets.[19] [20] ,
2.3 Cryptocurrency adoption in emerging economies
Cryptocurrency adoption in emerging economies is shaped by the interaction of economic necessity, technological readiness, and institutional conditions. One of the main drivers is the role of remittances, as digital currencies can provide faster and lower-cost alternatives to conventional transfer channels. By reducing transaction costs and transfer delays, they may also broaden financial access for unbanked and underbanked populations.[21]
In addition, economically unstable environments often strengthen cryptocurrency adoption. In contexts marked by inflation, currency depreciation, or weak trust in conventional banking systems, digital assets may serve as alternative stores of value and as instruments of financial resilience.[22] Cases such as Nigeria and Turkey illustrate how monetary instability can increase interest in cryptocurrencies as hedging tools and as alternatives to less reliable financial infrastructures.[23]
Adoption is also influenced by broader technological and socio-economic conditions. Higher levels of internet access, mobile connectivity, digital literacy, and platform innovation facilitate participation in digital financial ecosystems, while diaspora networks can further stimulate adoption through cross-border transfer needs.[24], [25] At the same time, regulatory uncertainty and concerns about illicit financial activity may constrain adoption, which highlights the importance of balanced legal frameworks that support innovation while preserving financial integrity.[26]
The literature suggests that cryptocurrency adoption in emerging economies should not be viewed solely as speculative behavior. Rather, it reflects the convergence of remittance needs, financial instability, technological opportunity, and institutional constraints, making cryptocurrencies relevant not only for investment but also for financial inclusion, value preservation, and participation in evolving digital financial ecosystems.[27]
2.4 Leapfrogging theory in digital finance
Leapfrogging theory explains how late-developing economies may accelerate structural transformation by bypassing intermediate stages of technological development and moving directly toward more advanced systems. Rather than following the gradual paths historically associated with industrialized economies, latecomer countries may exploit technological discontinuities to adopt modern infrastructures without the burden of legacy systems. This perspective emerged first in debates on development policy and technological diffusion, especially in relation to ICT, where scholars argued that developing economies could “skip stages” of technological evolution through the adoption of newer technologies. [28], [29], [30], [31]
The telecommunications sector offers one of the clearest empirical examples of leapfrogging. Many developing economies bypassed large-scale fixed-line expansion and instead adopted mobile communication technologies at scale. This transition reduced the financial and institutional costs associated with traditional network development while expanding connectivity and access, particularly among previously underserved populations. [32], [33], [34], [35]
More recently, the leapfrogging framework has been extended to digital finance. The spread of FinTech, mobile banking, and digital payment systems has enabled countries with weak conventional financial infrastructures to expand access to financial services without replicating the traditional branch-based banking model. In this sense, digital finance can be understood as a contemporary form of leapfrogging, in which financial systems evolve through digital platforms, mobile ecosystems, and alternative payment architectures rather than through the gradual expansion of physical banking networks. [36], [37]
At the same time, leapfrogging in digital finance is not automatic. Its success depends on broader institutional and technological conditions, including consumer protection, governance quality, digital capabilities, and innovation capacity. Emerging research suggests that technological readiness and digital capabilities can strengthen resilience and support structural transformation in developing economies, especially where institutional environments are capable of supporting innovation diffusion.[38], [39]
2.5 Conceptual framework of the study
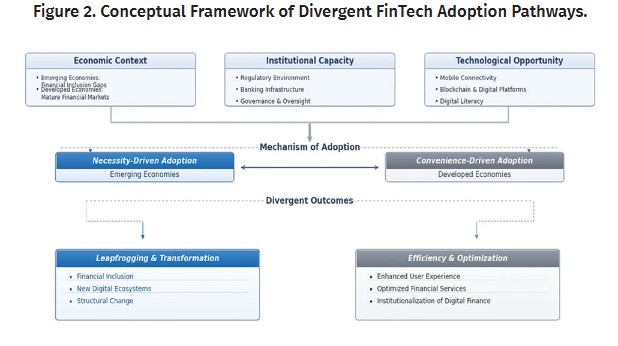
Building on the preceding literature, this study proposes a context-dependent FinTech adoption framework (Figure 2) to explain why FinTech adoption follows different trajectories across emerging and developed economies. Rather than treating adoption as a uniform or purely utility-driven process, the framework argues that FinTech integration is shaped by the interaction of economic context, institutional capacity, and technological opportunity.
In this framework, the antecedents of adoption differ across market environments. In developed economies, mature financial systems, strong regulatory oversight, and established banking infrastructures create a path-dependent environment in which FinTech tends to complement existing services. In emerging economies, by contrast, financial inclusion gaps, weaker banking infrastructures, and institutional limitations interact with growing technological opportunities-particularly mobile connectivity and digital platforms-to create conditions for more accelerated and substitution-oriented adoption.
The framework distinguishes between two main mechanisms of adoption. In emerging economies, adoption is primarily necessity-driven, as digital financial tools often compensate for limited access to conventional financial services. In developed economies, adoption is more convenience-driven, as FinTech is typically integrated into already mature financial systems in order to improve speed, cost efficiency, and user experience.
These contrasting mechanisms generate divergent outcomes. In developed markets, FinTech mainly leads to efficiency and optimization, including improved user experience, more streamlined financial services, and greater institutional integration. In emerging markets, it is more likely to contribute to leapfrogging and structural transformation, particularly by expanding financial inclusion, fostering new digital ecosystems, and enabling alternative forms of financial participation. The framework, therefore, positions FinTech not merely as a technological tool, but as a context-dependent structural force whose effects vary according to the institutional and economic environment. This conceptual logic guides the empirical analysis of digital payments and cryptocurrency adoption in the subsequent sections.
3. Data and Methodology
This section outlines the data sources, sample selection strategy, and analytical framework employed to investigate the divergent pathways of FinTech adoption across different economic contexts. The methodological approach is designed to empirically examine the Leapfrogging Hypothesis, which suggests that emerging economies may adopt digital financial technologies at accelerated rates due to structural gaps in traditional banking systems.
3.1. Data sources
To ensure cross-country comparability, this study relies on secondary data from internationally recognized sources. A triangulated data strategy is used, combining digital payment indicators from Statista Market Insights, cryptocurrency adoption rankings from the 2025 Chainalysis Global Crypto Adoption Index, and financial inclusion and mobile connectivity indicators from the World Bank Global Findex Database (2025). Statista data are used to measure the scale and intensity of digital payment adoption, Chainalysis rankings serve as a proxy for grassroots crypto-adoption intensity, and Global Findex indicators-particularly account ownership, unbanked population, and mobile phone ownership-provide the broader financial inclusion context. Together, these datasets support a comparative analysis of digital payments, cryptocurrency adoption, and FinTech leapfrogging across the selected economies.
3.2 Sample selection
The study employs a stratified purposive sampling strategy to select ten representative economies that capture contrasting patterns of financial infrastructure and digital financial adoption. The sample is divided into two groups according to economic development levels, financial inclusion conditions, cryptocurrency ownership estimates, and crypto-adoption intensity.
Group A: Emerging economies
This group includes India, Vietnam, Nigeria, Brazil, and the Philippines, which rank among the leading countries in the 2025 Chainalysis Global Crypto Adoption Index. These economies also display relatively strong cryptocurrency ownership estimates and persistent financial inclusion gaps. Cryptocurrency ownership is particularly high in Vietnam (≈21.2%) and the Philippines (≈19.0%), while Brazil and Nigeria record levels above approximately 12–13%. Although India shows a lower ownership estimate (≈7.2%), it ranks first globally in overall crypto-adoption intensity. At the same time, World Bank Global Findex data indicate that several of these economies continue to exhibit substantial shares of unbanked adults, making them relevant cases for examining whether digital financial technologies may compensate for incomplete traditional financial infrastructures.
Group B: Developed economies
The second group includes the United States, the United Kingdom, Germany, Sweden, and Japan, representing advanced economies with highly developed financial systems and near-universal banking access. In these countries, the share of unbanked adults generally remains below 5%. Cryptocurrency ownership estimates are moderate, reaching 15.6% in the United States, 11.2% in the United Kingdom, and 9.8% in Germany, while remaining lower in Sweden (≈4.3%) and Japan (≈4.0%). These economies were selected to provide a contrasting set of cases in which crypto adoption occurs within mature banking systems and is more likely to be associated with investment, portfolio diversification, and institutional participation than with financial exclusion.
This comparative framework enables the study to assess whether FinTech adoption follows distinct pathways across emerging and developed economies and whether these patterns are consistent with the Leapfrogging Hypothesis.
3.3 Operationalization of variables
To examine the relationship between financial infrastructure, digital payment expansion, and cryptocurrency adoption, the study employs a set of variables grouped into four categories: adoption indicators, contextual financial infrastructure indicators, technological enablers, and structural drivers. Adoption indicators include digital payment transaction value, Compound Annual Growth Rate (CAGR), Average Transaction Value (ATV), Mobile POS penetration, the composition of payment instruments within Mobile POS, and cryptocurrency adoption intensity. These variables are used to capture the scale, speed, depth, and structural form of digital financial adoption. Contextual financial infrastructure indicators-such as credit card penetration, debit card penetration, online banking penetration, and bank account ownership-are included to assess the maturity of the formal financial system. In addition, mobile phone ownership is used as a technological enabler reflecting digital access potential, while the share of unbanked adults is treated as a structural driver indicating gaps in formal financial inclusion. Taken together, these variables provide a framework for analyzing whether FinTech adoption in emerging economies reflects patterns consistent with leapfrogging dynamics.
3.4 Analytical method
The study adopts a Comparative Trend Analysis (CTA) approach to examine cross-country differences in FinTech adoption rather than using econometric regression. This choice is justified by the purposive sample design and by the study’s emphasis on structural comparison across a limited set of representative economies.
The empirical analysis proceeds in four stages. First, the study examines the historical evolution and projected trends of Average Transaction Value (ATV) in order to assess the depth and intensity of digital payment use. Second, it calculates the Compound Annual Growth Rate (CAGR) of Mobile POS payment transaction values between 2018 and 2025 to measure the comparative speed of digital payment expansion. Third, it analyzes Mobile POS penetration rates, payment instrument composition, and broader financial infrastructure indicators in order to compare the institutional environment of digital payment adoption across the two groups. Fourth, it assesses cryptocurrency adoption by combining Chainalysis crypto-adoption rankings with account ownership, unbanked population, and mobile phone ownership indicators from Global Findex.
Visualization techniques are used to support comparative interpretation, including line charts, comparative tables, and scatter plots. In the cryptocurrency analysis, scatter plots are used to examine the relationship between financial exclusion and crypto-adoption intensity. Because lower Chainalysis ranks indicate stronger adoption, the relevant y-axis is reversed in order to improve interpretability.
The CAGR is calculated using the following formula:

V final: represents the final transaction value
V begin: represents the initial value
n: represents the number of years
This metric enables comparison of adoption trajectories across economies with different market sizes and provides a standardized measure of digital payment growth.
3.5 Data limitations
Despite the robustness of the datasets used, several limitations remain. Some Statista Market Insights indicators include projections rather than observed values, and should therefore be interpreted as likely trajectories rather than realized outcomes. The Chainalysis Global Crypto Adoption Index captures relative adoption intensity rather than direct ownership shares, making it more suitable for comparative ranking than for estimating the exact proportion of crypto users. In addition, the World Bank Global Findex is based on periodic survey waves rather than annual observations. Finally, all indicators are measured at the national level and may therefore mask important intra-country differences. Nevertheless, the triangulation of multiple data sources strengthens the reliability of the comparative analysis.
4. Empirical analysis
This section presents the empirical findings of the study, focusing on the comparative dynamics of digital payment growth, cryptocurrency adoption patterns, and structural indicators related to financial inclusion. The analysis aims to identify whether emerging economies exhibit evidence of FinTech leapfrogging compared to developed financial systems.
4.1 Growth dynamics of digital payments
To analyze the trajectory of digital finance, it is necessary to define the parameters of the Digital Payments Market. According to the framework established by Statista Market Insights, this segment is primarily driven by consumer transactions and is divided into two main structural components:
- Digital Commerce: Encompasses all consumer transactions for products and services conducted over the internet, representing the online dimension of the digital economy.
- Mobile POS Payments: Includes digital payments made at a physical Point of Sale (POS) via digital wallet applications (e.g., Apple Pay, Google Pay, UPI, or Pix).
The market valuation integrates several key indicators, including total transaction values, the number of users, and the Average Transaction Value (ATV) per user. The latter serves as a proxy for the depth of digital financial integration into the daily lives of consumers. It is important to note that the empirical data and projections presented in this study reflect market conditions and recorded figures as of October 27, 2025.
4.1.1. Analysis of Average Transaction Value (ATV) trends
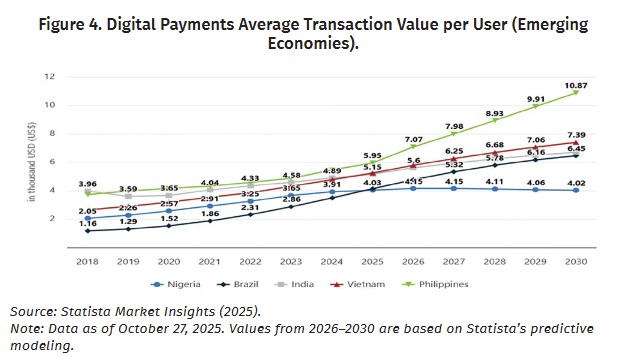
Average Transaction Value (ATV) per user provides an important indicator of the economic intensity of digital payment use, as it captures not merely access to digital finance, but the depth of user engagement within digital payment ecosystems. Based on data retrieved on October 27, 2025, Figures 3 and 4 show the historical evolution of ATV between 2018 and 2025 and the projected trends for the period 2026–2030.
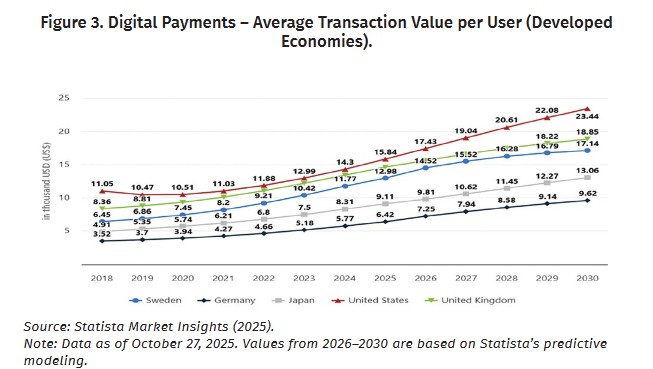
In developed economies, ATV remained consistently high throughout the study period. The United States recorded the highest values, increasing from US$11.05k in 2018 to US$15.84k in 2025, with projections reaching US$23.44k by 2030. Similar but more moderate trends are observed in the United Kingdom, Germany, Japan, and Sweden. This pattern reflects convenience-driven adoption in mature financial systems, where digital payments are integrated into already well-established banking and consumption structures.
In emerging economies, ATV started from lower levels but grew more rapidly in several cases. Brazil rose from US$1.16k in 2018 to US$4.13k in 2025, while Vietnam and the Philippines increased from roughly US$2.6k–3.7k to about US$5.2k–5.95k over the same period. Projections suggest further acceleration, especially in the Philippines, where ATV is expected to reach US$10.87k by 2030, and in Vietnam, which is projected to reach US$7.39k. These trends suggest that digital payments in some emerging markets are becoming a core transactional infrastructure rather than a simple complement to traditional finance.
The contrast between the two groups indicates that developed economies maintain higher absolute values, while emerging economies display faster growth dynamics. This pattern appears consistent with the leapfrogging perspective, according to which economies with weaker traditional banking infrastructure may adopt digital financial solutions more rapidly and embed them more deeply in everyday economic activity.
4.1.2 Growth dynamics of mobile POS payments
To assess structural change in payment systems, this study uses Mobile POS Payments as a key indicator of the digitalization of everyday transactions. Unlike Digital Commerce, which reflects online purchasing, Mobile POS payments capture the shift in face-to-face payment behavior. In emerging economies, their rapid expansion may reflect leapfrogging dynamics, as users move directly from cash-based systems to mobile-native payment ecosystems. Table 1, therefore, compares Mobile POS transaction growth across developed and emerging economies using CAGR for the period 2018–2025.
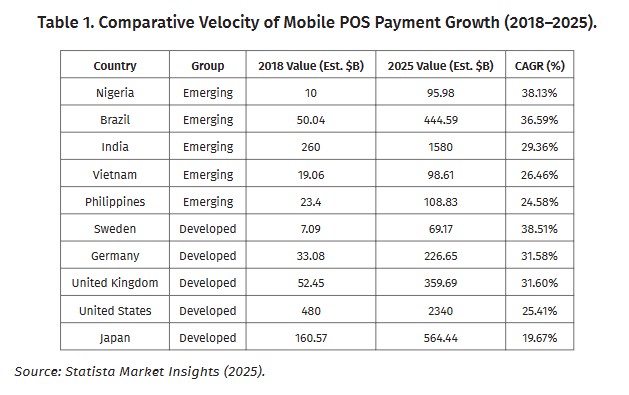
The results reported in Table 1 reveal clear differences in the growth dynamics of mobile POS payments across developed and emerging economies. In both groups, mobile payment transaction values increased substantially between 2018 and 2025; however, the structural meaning of this growth differs across contexts.
In emerging economies, high CAGR levels in countries such as Nigeria, Brazil, and India suggest that mobile payments are expanding not merely as a complementary payment option, but increasingly as an alternative transactional infrastructure. This pattern appears consistent with the leapfrogging perspective, whereby economies with more limited traditional banking and card-based infrastructures adopt mobile-first payment systems more rapidly. In such contexts, mobile payments may reduce reliance on cash while also widening access to formal financial channels.
In developed economies, growth is also significant, as shown in the cases of Sweden, the United Kingdom, and Germany. However, in these markets, the expansion of mobile POS payments is better interpreted as the optimization of already mature financial ecosystems rather than a substitute for missing financial infrastructure. Adoption is therefore more convenience-driven, supported by high banking penetration, strong digital trust, and established payment networks.
Japan represents a more gradual trajectory, which may reflect the persistence of legacy payment habits and the continued relevance of traditional payment instruments within a highly developed financial system. By contrast, the stronger expansion observed in several emerging economies suggests that mobile payment technologies can play a more transformative role when introduced in contexts characterized by financial access gaps or weaker card-payment penetration.
4.1.3. Penetration rate of mobile POS payments
Penetration rate is used here as a complementary indicator of societal diffusion and is interpreted jointly with transaction value and usage-intensity measures in order to provide a more comprehensive assessment of digital payment transformation.
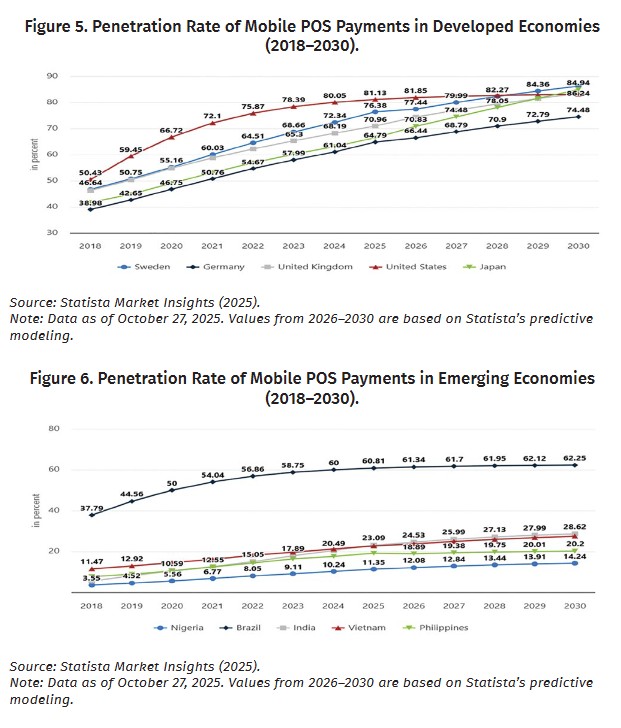
The data for 2018–2025 reveal a clear contrast between developed and emerging economies. In developed economies, penetration rates were already high and continued to rise steadily, increasing from 50.43% to 81.13% in the United States and from 46.64% to 76.38% in Sweden. Germany, the United Kingdom, and Japan followed similar upward paths, indicating that Mobile POS payments are deeply embedded in mature and highly banked financial systems. In emerging economies, the trajectories were more uneven but still significant. Brazil recorded the highest penetration rate in this group, rising from 37.79% in 2018 to 60.81% in 2025, while India and Vietnam increased from 5.47% to 23.09% and from 11.47% to 22.72%, respectively. Nigeria and the Philippines also progressed, from 3.55% to 11.35% and from 7.70% to 19.14%. Projections for 2026–2030 suggest continued growth in both groups, although developed economies appear closer to saturation, with Sweden, Japan, the United States, and the United Kingdom projected to reach 86.24%, 84.94%, 83.06%, and 83.38%, respectively, by 2030. In emerging economies, convergence remains partial: Brazil is projected to reach 62.25%, while India and Vietnam are expected to remain below 30%, at 28.62% and 27.51%, respectively. Taken together with transaction value and usage-intensity indicators, these results suggest that Mobile POS expansion reflects optimization in developed economies and uneven but significant leapfrogging dynamics in selected emerging markets.
4.1.4 Financial infrastructure indicators in developed and emerging economies
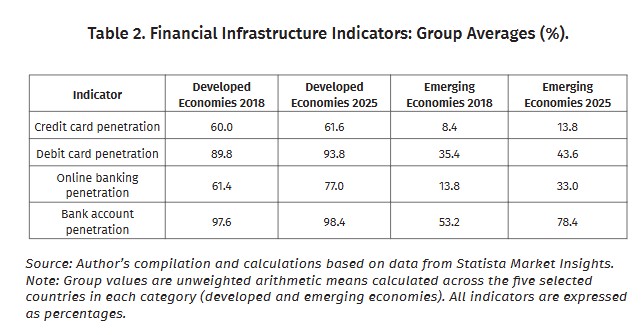
To contextualize differences in Mobile POS adoption, it is useful to consider broader financial infrastructure indicators across the two groups. As shown in Table 2, developed economies exhibit consistently higher levels of financial inclusion and card-based infrastructure. In 2025, average credit card penetration reached 61.6% in developed economies, compared with 13.8% in emerging economies, while debit card penetration stood at 93.8% versus 43.6%. A similar gap is observed in online banking penetration (77.0% in developed economies compared with 33.0% in emerging economies) and bank account penetration (98.4% versus 78.4%). These differences suggest that advanced economies continue to rely on mature banking and card-centered systems, whereas emerging economies are expanding digital finance from a less developed institutional base. This broader structural contrast helps explain why Mobile POS growth in emerging markets may be more closely associated with leapfrogging dynamics than in developed ones.
4.1.5 Structural composition of payment instruments within mobile POS payments
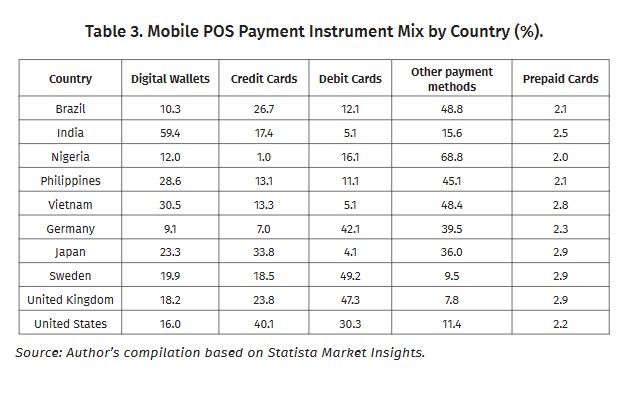
To further evaluate the Leapfrogging Hypothesis, it is useful to examine the composition of payment instruments within the Mobile POS Payments segment across the selected economies. Rather than reflecting the overall structure of national payment systems, this indicator shows how transaction value is distributed across different instruments within mobile-based point-of-sale payments. It therefore provides a more specific perspective on the channels through which mobile payment adoption is taking place.
The results reveal notable differences between emerging and developed economies. Within the Mobile POS segment, digital wallets account for a relatively large share of transaction value in several emerging economies, particularly in India (59.4%), Vietnam (30.5%), and the Philippines (28.6%). These shares are substantially higher than those observed in Germany (9.1%) and the United States (16.0%), suggesting that wallet-based instruments play a more central role in Mobile POS transactions in several emerging markets.
By contrast, developed economies remain more strongly oriented toward card-based instruments within the same segment. Debit cards account for 49.2% of Mobile POS transaction value in Sweden, 47.3% in the United Kingdom, and 42.1% in Germany, while credit cards represent 40.1% in the United States and 33.8% in Japan. This indicates that, even within Mobile POS payments, advanced economies continue to rely heavily on established card-linked infrastructures.
Another notable feature is the large share of the category “Others” in some emerging economies, especially Nigeria (68.8%) and Brazil (48.8%). Since this category may include a range of payment arrangements, it should be interpreted with caution. Nevertheless, its prominence suggests that the Mobile POS segment in these markets is not shaped exclusively by conventional debit- and credit-card instruments.
4.2. Reassessing the cryptocurrency adoption paradox
The cryptocurrency adoption paradox refers to the observation that some economies with weaker levels of financial inclusion may nevertheless record relatively high levels of cryptocurrency adoption. To reassess this issue more rigorously, this subsection combines two complementary indicators: the 2025 Chainalysis Global Crypto Adoption Index and the World Bank Global Findex 2025 account-ownership indicator. Rather than relying on estimated cryptocurrency ownership shares, the analysis uses the Chainalysis ranking as a proxy for the intensity of grassroots crypto adoption, while financial inclusion is measured through the share of adults aged 15 and above who own an account at a financial institution or with a mobile-money-service provider. The unbanked population is therefore calculated as the inverse of account ownership.
4.2.1. Comparative patterns of cryptocurrency adoption
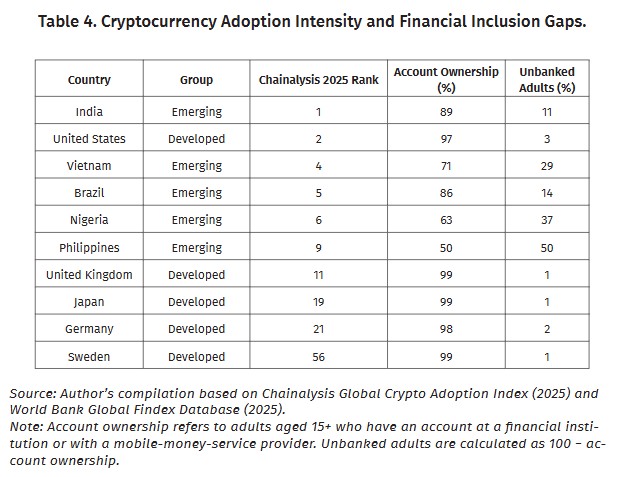
Table 4. shows that cryptocurrency adoption does not follow a single developmental pattern across the selected economies. Within the sample, India ranks first in the 2025 Chainalysis Global Crypto Adoption Index, followed by the United States in second place, Vietnam in fourth, Brazil in fifth, Nigeria in sixth, and the Philippines in ninth. Among the developed economies, the United Kingdom ranks eleventh, Japan nineteenth, Germany twenty-first, and Sweden fifty-sixth. These results indicate that relatively strong cryptocurrency adoption can be observed in both emerging and developed economies, although with substantial variation in intensity.
The distribution of these rankings suggests that several emerging economies occupy leading positions in the global index, which is consistent with the argument that cryptocurrencies may serve functions extending beyond portfolio investment alone. At the same time, the position of the United States shows that high adoption can also occur in mature financial systems characterized by near-universal banking access and expanding institutional participation. Conversely, Sweden’s much lower position, despite its highly advanced digital-payment environment, suggests that a sophisticated cashless economy does not automatically translate into equally strong cryptocurrency adoption.
4.2.2. Interpreting the paradox: Divergent adoption pathways
When these rankings are interpreted together with financial inclusion data, the cryptocurrency adoption paradox appears more nuanced than a simple inverse relationship between banking weakness and crypto uptake. The clearest cases consistent with the paradox are Nigeria and the Philippines, where relatively high crypto-adoption rankings coexist with comparatively large shares of unbanked adults. In such contexts, cryptocurrency adoption may reflect the use of alternative channels for payments, remittances, peer-to-peer transfers, and value storage where formal financial access remains incomplete. This interpretation is broadly consistent with the study’s distinction between necessity-driven and convenience-driven FinTech adoption.
However, other emerging economies complicate a purely exclusion-based explanation. India ranks first globally despite a high level of account ownership, while Brazil and Vietnam also combine strong crypto-adoption rankings with expanding formal financial inclusion. In these cases, adoption appears to be linked not only to financial necessity but also to mobile-first digital ecosystems, rapid platform expansion, and broader participation in digital financial markets. In developed economies, especially the United States and the United Kingdom, cryptocurrency adoption appears more closely associated with investment behavior, institutionalization, and regulatory normalization than with financial exclusion. The inclusion of an institutional activity sub-index in the 2025 Chainalysis methodology further reinforces the relevance of this interpretation for advanced markets.
4.2.3. Assessing FinTech leapfrogging
To further assess the leapfrogging hypothesis, it is useful to examine cryptocurrency adoption in relation to both financial exclusion and mobile connectivity. Using Global Findex 2025 indicators on account ownership and mobile phone ownership, together with the 2025 Chainalysis Global Crypto Adoption Index, this subsection explores whether stronger mobile connectivity may help explain high levels of crypto adoption in contexts where formal financial inclusion remains incomplete. Rather than treating cryptocurrency uptake as a purely investment-driven phenomenon, this approach considers whether digital connectivity may facilitate alternative forms of financial participation in selected emerging economies.
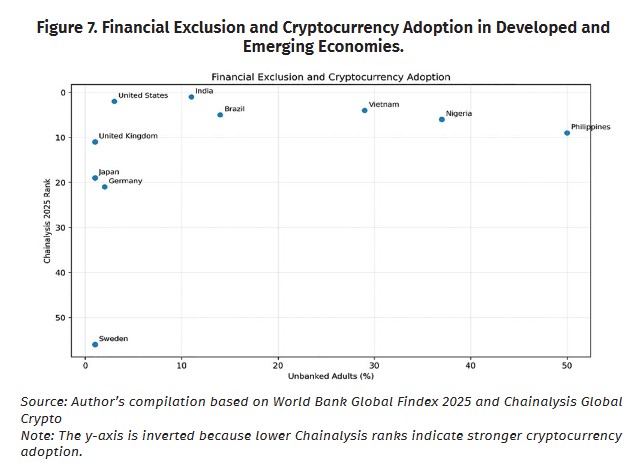
Although Figure 7 maps financial exclusion against cryptocurrency adoption intensity, mobile phone ownership provides an important complementary layer of interpretation. In the selected emerging economies, mobile phone ownership remains relatively high despite persistent financial inclusion gaps, reaching 98% in Vietnam, 92% in Brazil, 84% in Nigeria, and 78% in the Philippines, while India records 66%. In developed economies, mobile phone ownership is even higher, ranging from 92% in the United Kingdom and Germany to 99% in Sweden. These figures suggest that mobile connectivity is widespread across both groups, but its interaction with financial exclusion differs across contexts. In emerging markets, high mobile access combined with incomplete formal financial inclusion may create favorable conditions for stronger crypto adoption. By contrast, in developed economies, high mobile connectivity alone does not appear sufficient to generate equally strong adoption intensity.
The data suggest that high cryptocurrency adoption in some emerging economies is associated not only with financial inclusion gaps, but also with relatively strong levels of mobile connectivity. The Philippines, Nigeria, and Vietnam combine higher shares of unbanked adults with comparatively strong crypto-adoption rankings, while also displaying substantial mobile phone ownership. This pattern appears consistent with the leapfrogging argument, according to which populations may adopt digital financial alternatives when mobile access is available but formal financial services remain incomplete.
At the same time, the relationship is not uniform across all cases. India combines a relatively low unbanked rate with the highest crypto-adoption ranking in the sample, while Brazil also shows strong adoption despite more limited financial exclusion than Nigeria or the Philippines. These cases suggest that cryptocurrency adoption may also expand within broader digital-finance ecosystems shaped by mobile-first usage, platform expansion, and growing participation in digital markets.
The developed economies in the sample provide an important contrast. Japan, Germany, and Sweden combine near-universal financial inclusion with lower crypto-adoption intensity than several emerging markets, despite high levels of mobile phone ownership. This suggests that mobile connectivity alone does not explain adoption. Rather, strong crypto uptake appears more likely where digital readiness interacts with unmet financial needs or alternative financial use cases. The United States is a partial exception, as it combines very high financial inclusion with a strong adoption rank, indicating that institutional participation and investment-related demand remain important drivers in advanced markets.
Conclusion
This study examined whether FinTech adoption follows different pathways across emerging and developed economies, with a particular focus on digital payments and cryptocurrency adoption. The findings show that FinTech diffusion is context-dependent and shaped by differences in financial infrastructure, institutional capacity, and technological readiness.
The analysis of digital payments reveals two broad patterns. In developed economies, growth mainly reflects the optimization of mature financial systems through higher efficiency, convenience, and deeper integration of digital payment tools. In emerging economies, by contrast, stronger growth in several indicators suggests a more structural transformation, in which digital payments increasingly function as an alternative transactional infrastructure. This pattern is consistent with the leapfrogging perspective, especially where digital tools expand faster than traditional banking access.
The analysis of cryptocurrency adoption further supports this conclusion, but in a more nuanced way. The results do not confirm a simple inverse relationship between weak financial inclusion and high crypto adoption. Instead, they indicate multiple adoption pathways. In some emerging economies, cryptocurrency appears to operate as a partial substitute for incomplete financial services, while in developed economies it is more closely associated with investment, institutional participation, and broader digital financial innovation.
The main contribution of this study lies in integrating digital payments and cryptocurrency adoption within a single comparative framework of FinTech leapfrogging. It shows that FinTech should be understood not merely as a technological innovation, but as a structural and context-sensitive process. From a policy perspective, the findings highlight the importance of inclusive digital infrastructure, mobile connectivity, financial literacy, and balanced regulation. Future research could expand the country sample, apply econometric testing, and further examine the role of regulatory quality and digital safety in shaping FinTech adoption.
References:
References
- >
- Bhasin, N. K., Rajesh, A. (2020). Study of increasing adoption trends of digital banking and FinTech products in Indian payment systems and improvement in customer services. In Collaborative Convergence and Virtual Teamwork for Organizational Transformation, IGI Global, 229–255. <https://doi.org/10.4018/978-1-7998-4891-2.ch012>;
- Burlamaqui, L., Kattel, R. (2016). Development as leapfrogging, not convergence, not catch-up: Towards Schumpeterian theories of finance and development. Review of Political Economy, 28(2), 270–288. <https://doi.org/10.1080/09538259.2016.1142718>;
- Chitimira, H., Ncube, M. (2020). Legislative and other selected challenges affecting financial inclusion for the poor and low income earners in South Africa. Journal of African Law, 64(3), 337–355. <https://doi.org/10.1017/S0021855320000182>;
- Cook, S. (2017). Selfie banking: Is it a reality? Biometric Technology Today, 2017(3), 9–11. <https://doi.org/10.1016/S0969-4765(17)30056-5>;
- Dang, T. H. N., Balli, F., Balli, H. O., Kilic, I. (2025). Demographic-governance factors shaping cryptocurrency holding behavior. Finance Research Letters, 85(Part D), 108143. <https://doi.org/10.1016/j.frl.2025.108143>;
- Dat, P. T., Oanh, T. T. K. (2025). Linkage between financial inclusion, financial development and financial stability: Perspectives from developing and developed countries. Annals of Financial Economics, 20(4), Article 2550022. <https://doi.org/10.1142/S2010495225500228>;
- Demir, A., Pesqué-Cela, V., Altunbas, Y., Murinde, V. (2022). Fintech, financial inclusion and income inequality: A quantile regression approach. European Journal of Finance, 28(1), 86–107. <https://doi.org/10.1080/1351847X.2020.1772335>;
- El Hajj, M., Farran, I. (2024). The Cryptocurrencies in Emerging Markets: Enhancing Financial Inclusion and Economic Empowerment. Journal of Risk and Financial Management, 17(10), 467. <https://doi.org/10.3390/jrfm17100467>;
- Fong, M. W. L. (2008). The mobile phone telecommunications service sector in China. In Mobile Computing: Concepts, Methodologies, Tools, and Applications. <https://doi.org/10.4018/978-1-60566-054-7.ch108>;
- Ghosh, P., Golder, U. (2026). Exploring the effects of FinTech adoption on traditional banking: A systematic literature review on opportunities and challenges. Digital Business, 6(1), 100163. <https://doi.org/10.1016/j.digbus.2026.100163>;
- Hanif, R., Pierotti, M., Khalique, M. (2026). Harnessing technological innovation and digital capabilities for resilience in developing economies. Sustainable Technology and Entrepreneurship, 5(1), 100124. <https://doi.org/10.1016/j.stae.2025.100124>;
- Huang, C.-Y. (2011). Rethinking leapfrogging in the end-user telecom market. Technological Forecasting and Social Change, 78(4), 703–712. <https://doi.org/10.1016/j.techfore.2010.10.009>;
- James, J. (2012). The distributional effects of leapfrogging in mobile phones. Telematics and Informatics, 29(3), 294–301. <https://doi.org/10.1016/j.tele.2011.09.001>;
- Karani, G., Jadhav, B. (2025). How traditional banks adapt to the fintech revolution in banking and finance sector. In Shaping Cutting-Edge Technologies and Applications for Digital Banking and Financial Services, Taylor & Francis, 214–225. <https://doi.org/10.4324/9781003501947-13>;
- Khan, K., Luo, T., Ullah, S., Rasheed, H. M. W., Li, P.-H. (2023). Does digital financial inclusion affect CO2 emissions? Evidence from 76 emerging markets and developing economies (EMDEs). Journal of Cleaner Production, 420, 138313. <https://doi.org/10.1016/j.jclepro.2023.138313>;
- Khatatbeh, I. N., Mustafa, J. A., Alhusban, M. I., Alfoul, M. N. A., Shammout, E. (2026). The role of fintech governance in enhancing financial inclusion and reducing income inequality in MENA countries. Journal of Governance and Regulation, 15(1), 150–159. <https://doi.org/10.22495/jgrv15i1art14>;
- Kumar, I. (2024). Banking services and financial inclusion in India’s poorest regions. Journal of Banking Regulation, 25(2), 145–159. <https://doi.org/10.1057/s41261-023-00224-9>;
- Le, M.-Q., Nguyen, T.-H., Dao, V., Nguyen, P., Vu, D.-L., Nguyen, H.-M., Tran, T.-T. (2025). Research on the impacts of financial inclusion towards national economic growth during the period 2014–2022: New findings and policy implications. In Springer Proceedings in Business and Economics, Springer, 507–530. <https://doi.org/10.1007/978-981-97-9992-3_33>;
- Logan, S., Singh, J. P. (2018). The meta-power of technology. In Technologies of International Relations: Continuity and Change. <https://doi.org/10.1007/978-3-319-97418-7_6>;
- Mhlanga, D. (2023). Artificial intelligence (AI) solutions for financial inclusion of the excluded: What are the challenges? In Advances in African Economic, Social and Political Development, Springer, 257–272. <https://doi.org/10.1007/978-3-031-31431-5_14>;
- Parino, F., Beiró, M. G., Gauvin, L. (2018). Analysis of the Bitcoin blockchain: socio-economic factors behind the adoption. EPJ Data Sci. 7, 38. <https://doi.org/10.1140/epjds/s13688-018-0170-8>;
- Patwardhan, A. (2018). Financial inclusion in the digital age. In Kuo, D. L., Deng, R. H. (Eds.). Handbook of blockchain, digital finance, and inclusion, Volume 1: Cryptocurrency, fintech, insurtech, and regulation, Elsevier, 57–89. <https://doi.org/10.1016/B978-0-12-810441-5.00004-X>;
- Rai, A. K., Kumar, A., Bhatt, A. K., Esubalew, A. A., Rai, S. (2025). Innovative approaches to financial inclusion in emerging economies: A case study analysis of India and Ethiopia. In Sustainable Finance, Springer, 125–146. <https://doi.org/10.1007/978-3-032-01677-5_6>;
- Ranganathan, K. (2012). Leapfrogging the digital divide: Myth or reality for emerging regions? In ICT Influences on Human Development, Interaction, and Collaboration. <https://doi.org/10.4018/978-1-4666-1957-9.ch014>;
- Ritzer, G. (2012). Leapfrogging. In The Wiley-Blackwell Encyclopedia of Globalization. <https://doi.org/10.1002/9780470670590.wbeog355>;
- Rodima-Taylor, D., Grimes, W. W. (2019). International remittance rails as infrastructures: embeddedness, innovation and financial access in developing economies. Review of International Political Economy, 26(5), 839–862. <https://doi.org/10.1080/09692290.2019.1607766>;
- Sanzogni, L., Arthur-Gray, H. (2007). Technology leapfrogging in Thailand. In Global Information Technologies: Concepts, Methodologies, Tools, and Applications. <https://doi.org/10.4018/978-1-59904-939-7.ch136>;
- Shah, P., Devdatta, S. T., Jayapriya, J., Vinay, M., Deepa, S. (2025). Technological innovation in digital payments: A survey of trends, challenges, and opportunities. In Lecture Notes in Networks and Systems, 1321 LNNS, Springer, 35–147. <https://doi.org/10.1007/978-981-96-4151-2_12> ;
- Sharma, M. (2021). Digital payments in India: Impact of emerging technologies. In Industry 4.0 Technologies for Business Excellence: Frameworks, Practices, and Applications, CRC Press, 191–204. <https://doi.org/10.1201/9781003140474-11>;
- Sikka, V., Bhayana, P. (2024). Barriers to comprehensive financial inclusion across the globe: From sociocultural norms to systemic challenges. In Sustainable Finance, Springer, 89–126. <https://doi.org/10.1007/978-3-031-67523-2_7>;
- Tan, B., Ng, E., Jiang, J. (2018). The process of technology leapfrogging: Case analysis of the national ICT infrastructure development journey of Azerbaijan. International Journal of Information Management, 38(1), 311–316. <https://doi.org/10.1016/j.ijinfomgt.2017.10.008>;
- Third, A., Kao, K.-T. (2007). ICT leapfrogging policy and development in the third world. In Encyclopedia of Information Ethics and Security. <https://doi.org/10.4018/978-1-59140-987-8.ch049>;
- Tian, Y., Chan, T. J., Suki, N. M., Kasim, M. A. (2023). Moderating role of perceived trust and perceived service quality on consumers’ use behavior of Alipay e-wallet system: the perspectives of technology acceptance model and theory of planned behavior. Human Behavior and Emerging Technologies, 2023. <https://doi.org/10.1155/2023/5276406>;
- Tsang, M. (2023). Currency crisis: Turkey in 2021. The CASE Journal, 19(5), 679–698. <https://doi.org/10.1108/TCJ-08-2022-0140>;
- Vincent, G., Sivakumar, S. (2019). Financial inclusion in India – A progress and challenges. International Journal of Advanced Science and Technology, 28(19), 521–530;
- Visconti-Caparrós, J. M., Campos-Blázquez, J. R. (2022). The development of alternate payment methods and their impact on customer behavior: The Bizum case in Spain. Technological Forecasting and Social Change, 175, 121330. <https://doi.org/10.1016/j.techfore.2021.121330>;
- Zhang, Q., Valle-Sison, J. B. (2014). Financial inclusion and regulatory implications. In Global shock, risks, and Asian financial reform, Edward Elgar Publishing, 600–627. <https://doi.org/10.4337/9781783477944.00029> ;
- Zhao, D., Yuan, J., Chen, W. (2023). Financial consumer protection in FinTech field. In Contributions to Finance and Accounting. <https://doi.org/10.1007/978-981-99-5173-4_5>.
Footnotes:
[1] Patwardhan, A. (2018). Financial inclusion in the digital age. In Kuo, D. L., Deng, R. H. (Eds.). Handbook of blockchain, digital finance, and inclusion, Volume 1: Cryptocurrency, fintech, insurtech, and regulation, Elsevier, 57–89. <https://doi.org/10.1016/B978-0-12-810441-5.00004-X>.
[2] Zhang, Q., Valle-Sison, J. B. (2014). Financial inclusion and regulatory implications. In Global shock, risks, and Asian financial reform, Edward Elgar Publishing, 600–627. <https://doi.org/10.4337/9781783477944.00029>.
[3] Le, M.-Q., Nguyen, T.-H., Dao, V., Nguyen, P., Vu, D.-L., Nguyen, H.-M., Tran, T.-T. (2025). Research on the impacts of financial inclusion towards national economic growth during the period 2014–2022: New findings and policy implications. In Springer Proceedings in Business and Economics, Springer, 507–530. <https://doi.org/10.1007/978-981-97-9992-3_33>.
[4] Dat, P. T., Oanh, T. T. K. (2025). Linkage between financial inclusion, financial development and financial stability: Perspectives from developing and developed countries. Annals of Financial Economics, 20(4), Article 2550022. <https://doi.org/10.1142/S2010495225500228>.
[5] Demir, A., Pesqué-Cela, V., Altunbas, Y., Murinde, V. (2022). Fintech, financial inclusion and income inequality: A quantile regression approach. European Journal of Finance, 28(1), 86–107. <https://doi.org/10.1080/1351847X.2020.1772335>.
[6] Rai, A. K., Kumar, A., Bhatt, A. K., Esubalew, A. A., Rai, S. (2025). Innovative approaches to financial inclusion in emerging economies: A case study analysis of India and Ethiopia. In Sustainable Finance, Springer, 125–146. <https://doi.org/10.1007/978-3-032-01677-5_6>.
[7] Mhlanga, D. (2023). Artificial intelligence (AI) solutions for financial inclusion of the excluded: What are the challenges? In Advances in African Economic, Social and Political Development, Springer, 257–272. <https://doi.org/10.1007/978-3-031-31431-5_14>.
[8] Kumar, I. (2024). Banking services and financial inclusion in India’s poorest regions. Journal of Banking Regulation, 25(2), 145–159. <https://doi.org/10.1057/s41261-023-00224-9>.
[9] Patwardhan, A. (2018), 57–89.
[10] Sikka, V., Bhayana, P. (2024). Barriers to comprehensive financial inclusion across the globe: From sociocultural norms to systemic challenges. In Sustainable Finance, Springer, 89–126. <https://doi.org/10.1007/978-3-031-67523-2_7>.
[11] Khatatbeh, I. N., Mustafa, J. A., Alhusban, M. I., Alfoul, M. N. A., Shammout, E. (2026). The role of fintech governance in enhancing financial inclusion and reducing income inequality in MENA countries. Journal of Governance and Regulation, 15(1), 150–159. <https://doi.org/10.22495/jgrv15i1art14>.
[12] Chitimira, H., Ncube, M. (2020). Legislative and other selected challenges affecting financial inclusion for the poor and low income earners in South Africa. Journal of African Law, 64(3), 337–355. <https://doi.org/10.1017/S0021855320000182>.
[13] Shah, P., Devdatta, S. T., Jayapriya, J., Vinay, M., Deepa, S. (2025). Technological innovation in digital payments: A survey of trends, challenges, and opportunities. In Lecture Notes in Networks and Systems, 1321 LNNS, Springer, 35–147. <https://doi.org/10.1007/978-981-96-4151-2_12>.
[14] Tian, Y., Chan, T. J., Suki, N. M., Kasim, M. A. (2023). Moderating role of perceived trust and perceived service quality on consumers’ use behavior of Alipay e-wallet system: the perspectives of technology acceptance model and theory of planned behavior. Human Behavior and Emerging Technologies, 2023. <https://doi.org/10.1155/2023/5276406>.
[15] Visconti-Caparrós, J. M., Campos-Blázquez, J. R. (2022). The development of alternate payment methods and their impact on customer behavior: The Bizum case in Spain. Technological Forecasting and Social Change, 175, 121330. <https://doi.org/10.1016/j.techfore.2021.121330>.
[16] Ghosh, P., Golder, U. (2026). Exploring the effects of FinTech adoption on traditional banking: A systematic literature review on opportunities and challenges. Digital Business, 6(1), 100163. <https://doi.org/10.1016/j.digbus.2026.100163>.
[17] Karani, G., Jadhav, B. (2025). How traditional banks adapt to the fintech revolution in banking and finance sector. In Shaping Cutting-Edge Technologies and Applications for Digital Banking and Financial Services, Taylor & Francis, 214–225. <https://doi.org/10.4324/9781003501947-13>.
[18] Cook, S. (2017). Selfie banking: Is it a reality? Biometric Technology Today, 2017(3), 9–11. <https://doi.org/10.1016/S0969-4765(17)30056-5>.
[19] Bhasin, N. K., Rajesh, A. (2020). Study of increasing adoption trends of digital banking and FinTech products in Indian payment systems and improvement in customer services. In Collaborative Convergence and Virtual Teamwork for Organizational Transformation, IGI Global, 229–255. <https://doi.org/10.4018/978-1-7998-4891-2.ch012>.
[20] Sharma, M. (2021). Digital payments in India: Impact of emerging technologies. In Industry 4.0 Technologies for Business Excellence: Frameworks, Practices, and Applications, CRC Press, 191–204. <https://doi.org/10.1201/9781003140474-11>.
[21] Rodima-Taylor, D., Grimes, W. W. (2019). International remittance rails as infrastructures: embeddedness, innovation and financial access in developing economies. Review of International Political Economy, 26(5), 839–862. <https://doi.org/10.1080/09692290.2019.1607766>.
[22] El Hajj, M., Farran, I. (2024). The Cryptocurrencies in Emerging Markets: Enhancing Financial Inclusion and Economic Empowerment. Journal of Risk and Financial Management, 17(10), 467. <https://doi.org/10.3390/jrfm17100467>.
[23] Tsang, M. (2023). Currency crisis: Turkey in 2021. The CASE Journal, 19(5), 679–698. <https://doi.org/10.1108/TCJ-08-2022-0140>.
[24] Parino, F., Beiró, M. G., Gauvin, L. (2018). Analysis of the Bitcoin blockchain: socio-economic factors behind the adoption. EPJ Data Sci. 7, 38. <https://doi.org/10.1140/epjds/s13688-018-0170-8>.
[25] Dang, T. H. N., Balli, F., Balli, H. O., Kilic, I. (2025). Demographic-governance factors shaping cryptocurrency holding behavior. Finance Research Letters, 85(Part D), 108143. <https://doi.org/10.1016/j.frl.2025.108143>.
[26] Khan, K., Luo, T., Ullah, S., Rasheed, H. M. W., Li, P.-H. (2023). Does digital financial inclusion affect CO2 emissions? Evidence from 76 emerging markets and developing economies (EMDEs). Journal of Cleaner Production, 420, 138313. <https://doi.org/10.1016/j.jclepro.2023.138313>.
[27] Vincent, G., Sivakumar, S. (2019). Financial inclusion in India – A progress and challenges. International Journal of Advanced Science and Technology, 28(19), 521–530.
[28] Third, A., Kao, K.-T. (2007). ICT leapfrogging policy and development in the third world. In Encyclopedia of Information Ethics and Security. <https://doi.org/10.4018/978-1-59140-987-8.ch049>.
[29] Ritzer, G. (2012). Leapfrogging. In The Wiley-Blackwell Encyclopedia of Globalization. <https://doi.org/10.1002/9780470670590.wbeog355>.
[30] Logan, S., Singh, J. P. (2018). The meta-power of technology. In Technologies of International Relations: Continuity and Change. <https://doi.org/10.1007/978-3-319-97418-7_6>.
[31] Burlamaqui, L., Kattel, R. (2016). Development as leapfrogging, not convergence, not catch-up: Towards Schumpeterian theories of finance and development. Review of Political Economy, 28(2), 270–288. <https://doi.org/10.1080/09538259.2016.1142718>.
[32] Sanzogni, L., Arthur-Gray, H. (2007). Technology leapfrogging in Thailand. In Global Information Technologies: Concepts, Methodologies, Tools, and Applications. <https://doi.org/10.4018/978-1-59904-939-7.ch136>.
[33] Fong, M. W. L. (2008). The mobile phone telecommunications service sector in China. In Mobile Computing: Concepts, Methodologies, Tools, and Applications. <https://doi.org/10.4018/978-1-60566-054-7.ch108>.
[34] Huang, C.-Y. (2011). Rethinking leapfrogging in the end-user telecom market. Technological Forecasting and Social Change, 78(4), 703–712. <https://doi.org/10.1016/j.techfore.2010.10.009>.
[35] James, J. (2012). The distributional effects of leapfrogging in mobile phones. Telematics and Informatics, 29(3), 294–301. <https://doi.org/10.1016/j.tele.2011.09.001>.
[36] Tan, B., Ng, E., Jiang, J. (2018). The process of technology leapfrogging: Case analysis of the national ICT infrastructure development journey of Azerbaijan. International Journal of Information Management, 38(1), 311–316. <https://doi.org/10.1016/j.ijinfomgt.2017.10.008>.
[37] Ranganathan, K. (2012). Leapfrogging the digital divide: Myth or reality for emerging regions? In ICT Influences on Human Development, Interaction, and Collaboration. <https://doi.org/10.4018/978-1-4666-1957-9.ch014>.
[38] Zhao, D., Yuan, J., Chen, W. (2023). Financial consumer protection in FinTech field. In Contributions to Finance and Accounting. <https://doi.org/10.1007/978-981-99-5173-4_5>.
[39] Hanif, R., Pierotti, M., Khalique, M. (2026). Harnessing technological innovation and digital capabilities for resilience in developing economies. Sustainable Technology and Entrepreneurship, 5(1), 100124. <https://doi.org/10.1016/j.stae.2025.100124>.
Downloads

Published
Issue
Section
License

This work is licensed under a Creative Commons Attribution-ShareAlike 4.0 International License.
How to Cite
Share