Modern Possibilities of Data Visualization in Digital Platform of Moodle Learning Management System
DOI:
https://doi.org/10.35945/gb.2023.16.010Keywords:
Modern Technologies in Education, Data Visualization, Learning Management Systems, MoodleAbstract
The visualization of accumulated data is an important aspect of managing learning processes. The digitization and automatization of educational management systems, along with the increasing adoption of modern technologies, empower professors to track and analyze student performance across various platforms. This paper presents the implementation of a modern software extension (plugin) for Moodle, a popular and flexible learning management system, to visually represent the grades accumulated by students in various course activities. These software extensions possess robust capabilities for the visual presentation of statistical data, utilizing data from points accumulated in assessment components such as quizzes, presentations, midterms, final exams, etc. By employing these extensions, professors can easily observe the distribution of grades earned by individual students. Modern approaches to the management of learning processes increasingly embrace the power of data visualization, simplifying and enhancing the overall experience. Visualizations allow educators to quickly identify patterns, trends, and areas for improvement within their learning processes. This timely and insightful information facilitates informed decision-making and efficient resource allocation. By readily identifying areas of strength and weakness, educators can implement targeted interventions and adjustments to ensure all learners receive the optimal learning experience. This ongoing monitoring and refinement contribute to continuous quality improvement within the educational environment. Visualizations provide stakeholders with a clear and accessible overview of learning progress and outcomes. This transparency fosters open communication, collaboration, and trust among educators, learners, and administrators. To effectively leverage the power of data visualization, modern learning management systems (LMS) increasingly integrate with specialized software extensions. This paper discusses two particularly powerful plugins for the Moodle learning management system and their effectiveness.
Keywords: Modern Technologies in Education, Data Visualization, Learning Management Systems, Moodle
Introduction
This research aims to promote utilizing existing visualization tools in modern learning management systems to enhance the effectiveness of learning process management. Technologies play an integral role in achieving quality education and learning management systems (LMS) are becoming increasingly prevalent among educational institutions. Many institutions develop their platforms based on specific needs. Open-source distributed systems also exist, which offer relevant and various solutions for the learning/teaching process. Within this investigation, the focus is on software extensions in Moodle of data visualization, which is an advanced, free open-source platform (Gamage S.H.P.W., 2022)[1], (Walter Vladimir Flores-Piñas, 2022)[2], (Oproiu., 2015)[3], (Official Documentation of Moodle., 2023)[4], (Froissard Chris, 2015)[5], (Zhang Yaqun, 2020)[6].
The Moodle platform possesses a robust core functionality that effectively supports the fundamental needs of online learning environments. However, its capabilities can be further expanded and enhanced by utilizing software extensions, commonly called plugins. These plugins offer diverse features, activities, and integrations, allowing for the customization and augmentation of the learning experience to cater to specific pedagogical needs and user preferences. This inherent flexibility and extensibility position Moodle as a highly adaptable and versatile learning management system capable of evolving alongside the changing education landscape. Moodle plugins are extensions that augment the core functionality and broaden the capabilities of a Moodle learning management system (LMS). These software modules extend the platform’s inherent features and functionalities, offering instructors and administrators a more versatile and feature-rich environment for delivering and managing online educational content.
The importance of plugins for Moodle stems from their ability to dramatically extend the platform’s capabilities and functionalities. They offer a plethora of benefits that make Moodle a more versatile, adaptable, and user-friendly learning management system.
Here are some key reasons why plugins are crucial for Moodle:
Enhanced Functionality: Plugins allow Moodle to exceed its core features and cater to diverse educational needs. They introduce new activities, reports, blocks, integrations, and more, enabling instructors to design and deliver richer and more engaging learning experiences.
Adaptability and Customization: Plugins empower administrators and instructors to tailor the Moodle environment to their specific needs and preferences. They can choose plugins that align with their pedagogical approaches, integrate with existing systems, address accessibility concerns, and enhance the overall user experience. This adaptability makes Moodle suitable for a wide range of educational settings and diverse student populations.
Community-Driven Development: The vast community of Moodle developers continuously creates and contributes new plugins, constantly expanding the platform’s potential. This fosters innovation, ensures access to various tools and resources, and encourages collaboration within the Moodle community.
Cost-Effectiveness: Unlike custom development, plugins offer a cost-effective way to add new features to Moodle. Many plugins are available for free, while others offer reasonable licensing fees. This affordability makes Moodle an accessible platform for educational institutions with varying budgets.
Continuous Improvement: Plugin development often improves the core Moodle platform. Developers often identify and address user needs through plugin creation, which can eventually inspire core functionality integration. This ensures that the platform continuously evolves and adapts to the changing needs of the educational landscape.
Increased User Engagement: Plugins can contribute to increased user engagement by enhancing the accessibility and interactivity of the platform. For instance, plugins like Moodle Mobile allow users to access learning materials and engage with course content on their mobile devices. This flexibility and convenience can significantly improve student engagement and learning outcomes.
The use of data visualization tools, through which it is possible to effectively observe existing data, gives interesting and important results in the management system of educational processes (see. Froissard Chris, 2015), (see. Zhang Yaqun, 2020), (Tabatadze. B., 2023) [7]. The mentioned tools can be effectively used in the Moodle LMS (see. Froissard Chris, 2015), (see. Zhang Yaqun, 2020) system. The investigation comprises several stages, in the first stage, starts with discussing two Analytics Graphs and Grades Chart software plugins of Moodle for data visualization, subsequent stages involve their implementation in the Moodle system, and in the final stage, a detailed description of the methodology for utilizing these tools.
Analytics Graphs Plugin for Moodle
The Plugin Analytics Graphs is an extension of the Moodle learning management system, specifically designed to provide instructors with visual representations of student performance through five distinct graphs.
Grades Chart: This graph illustrates the grade distribution for all students enrolled in the course. Examination of this data enables identifying students encountering academic challenges and may necessitate additional support.
Figure 1. Grades Chart of the Analytics Graph.

Content Accesses: This graph depicts the distribution of unique resource utilization among users within the course. It serves as a visual tool to identify highly engaged learners and students who may require additional academic support.
Figure 2. Content Accesses of the Analytics Graph.

Number of Active Users: This graph shows how many users are active in a course at different times of day. It can be used to identify the times when the course is most active and to adjust the timing of activities accordingly.
Figure 3. Number of Active Users of the Analytics Graph.

Assignment Submissions: This visual representation depicts the submission status of assignments, differentiating between those completed on time and those submitted late. This data can be utilized to identify students who may be experiencing challenges with the course content, thereby enabling the provision of targeted support.
Figure 4. Assignment Submissions of the Analytics Graph.

Hits Distribution: Visualizations offer a significant understanding of how specific learners utilize course materials and supplementary resources during every unit. Examining this data allows instructors to gain deeper insight into student engagement patterns and pinpoint instances where learners may encounter difficulties or necessitate further assistance.
Figure 5. Hits Distribution of the Analytics Graph.

The Analytics Graphs of data visualizations facilitate the identification of potential performance issues and inform pedagogical decision-making, ultimately contributing to the optimization of educational outcomes. Implementing the Analytics Graphs plugin in the Moodle platform is very easy, without any fundamental technological knowledge.
Grades Chart Plugin for Moodle
The Plugin Grades Chart is a simple yet powerful tool for Moodle educators, specifically designed to enhance student learning and engagement within assigned tasks. The Grades Chart emerges as a valuable tool for Moodle educators seeking to enhance student learning and engagement. The plugin fosters a more dynamic and motivating learning environment by offering a clear visual representation of grades and encouraging self-evaluation. However, it’s crucial to consider its limitations and ensure its appropriate implementation based on specific course content and student needs.
The Plugin Grades Chart, featuring separate views for professors and students, offers a dual-pronged approach to enhancing graded assignments. For professors, it provides a visual distribution of points and facilitates performance analysis, while for students, it fosters self-evaluation and promotes transparency through point range visualization and estimated results, although the privacy of individual data is maintained.
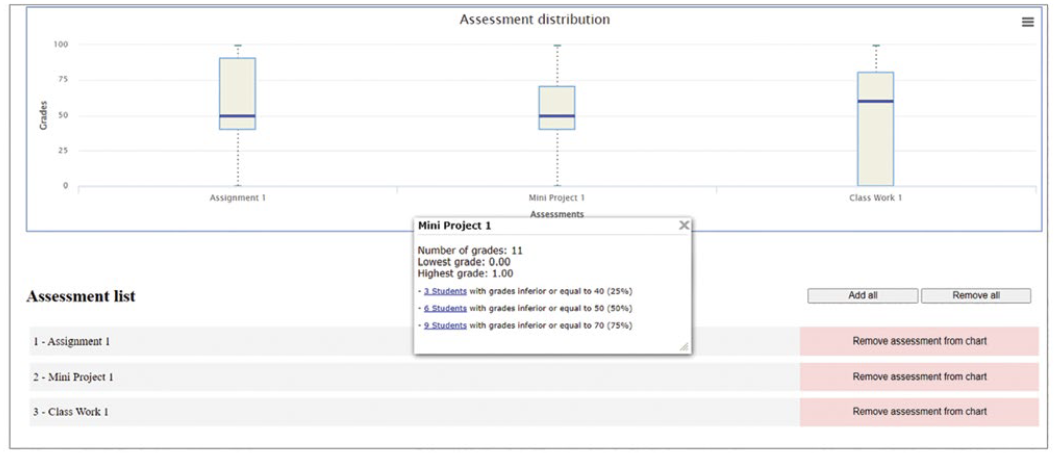
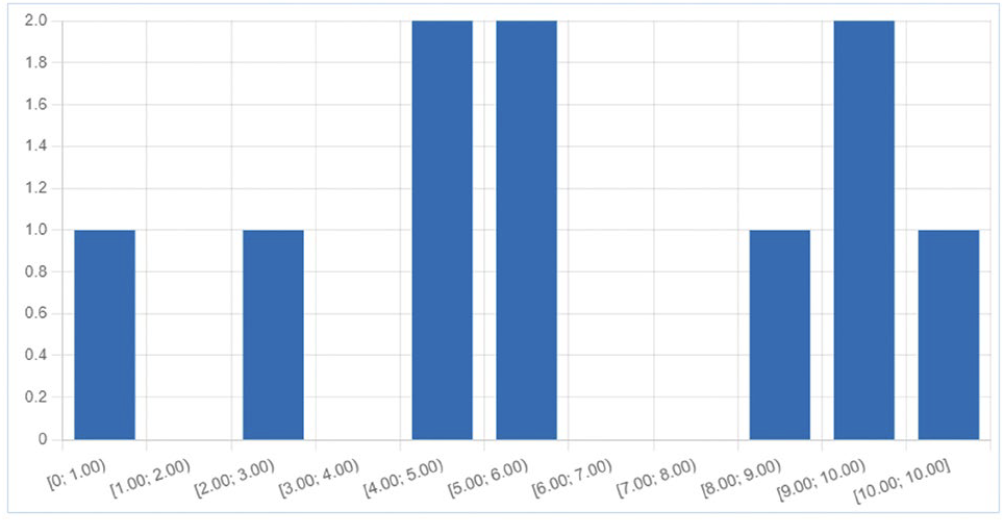
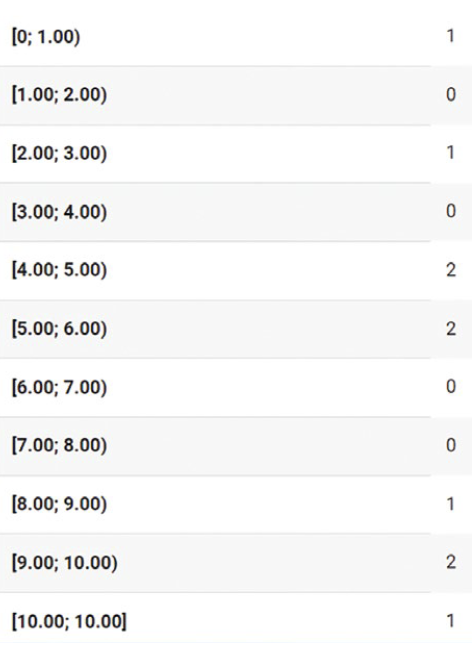
After installing the plugin and activating it for an assignment, it automatically generates a chart depicting the grade distribution for participating students. This visual representation provides valuable insights into individual performance and overall class progress.
Figure 6. Histograms of Grade Chart.

Figure 7. Points Distribution of Grade Chart.

The Plugin Grades Chart for Moodle is Useful for professors and students.
For professors:
Enhanced Grading Efficiency: The visual distribution of points streamlines the grading process, allowing for rapid identification of trends and potential discrepancies.
Data-Driven Insights: The chart offers valuable data-driven insights into student performance, enabling professors to tailor their teaching approaches and address individual needs effectively.
Improved Feedback Delivery: The plugin facilitates the provision of more targeted and meaningful feedback, as educators can readily identify areas requiring further clarification or support.
Enhanced Communication: The transparency offered by the plugin fosters open communication between educators and students, promoting a more collaborative learning environment.
For students:
Increased Self-Awareness: By visualizing the performance of their peers, students gain a deeper understanding of their strengths and weaknesses, fostering self-directed learning.
Motivation and Engagement: The plugin can fuel motivation by offering a visual representation of progress and achievement, encouraging students to strive for excellence.
Enhanced Learning Strategies: The data provided by the plugin empowers students to make informed decisions about their learning strategies, allowing them to allocate their time and resources effectively.
Reduced Anxiety: The transparency of the grading process can alleviate anxiety for students, as they are constantly aware of their standing and have a clear understanding of expectations.
Stakeholders’ Views on the Visualization of Learning Process Analytics Data.
Learning Process Analytics (LPA) is a powerful tool for enhancing teaching quality in general or individual subjects. In today’s data-driven world, learning process analytics (LPA) emerges as a powerful tool for educators seeking to improve the quality of teaching and student learning outcomes. By analyzing data generated throughout the learning process, LPA provides valuable insights into student behavior, engagement, and progress, enabling educators to make informed decisions about their teaching practices and subject design.
A survey was conducted in three Georgian higher educational institutions to evaluate the efficacy of analytical and assessment technological tools and their integration within the teaching administration process. The study included approximately 15 professors and 125 students.
Professors and teachers emphasize the important role of visual instruments in enhancing student engagement and learning outcomes. Technologies such as point distribution systems, resource allocation platforms, and visual representations of student activity empower learners to actively participate in the learning process by facilitating effective planning and management. Consequently, comprehensive course analytics is an important element for informed course design and implementation. By systematically analyzing the learning process, professors can gain valuable insights into how students learn best. This knowledge empowers them to develop more effective teaching plans, create a more supportive learning environment, and ensure all students reach their full potential.
Based on the student survey, implementing such tools is highly advantageous, positive, and quality-oriented. These tools empower students to assess their academic standing within individual or all courses of study, facilitating self-evaluation and enabling comparisons with their peers. Most students do this process informally through various social networks, but the data obtained is often fragmented and unreliable. Therefore, implementing structured tools presents a significant advancement in student self-assessment and grade comparison. Grades in a visually appealing format make it easier for students to understand their relative performance than others in the class and identify areas where they need improvement.
Conclusion
The Moodle (LMS) platform stands among the leading free, multifaceted, and multifunctional information systems designed for educational process management. This platform, adopted by numerous educational institutions, offers a user-friendly and flexible framework for implementing various software extensions, including visual tools designed to assess student resource utilization, activity levels, and academic performance. Integrating software extensions into open-source learning management systems like Moodle and the practical application of appropriate visualization tools represent innovative approaches to harnessing modern technologies in the ever-evolving field of education.
The study investigates the efficacy of two software extensions for Moodle, analyzing their impact on learning quality through enhanced analytics and visualization. Given the consensus among educational stakeholders regarding the positive influence of modern analytical and visualization technologies on learning and teaching outcomes, institutions utilizing the Moodle learning management system should consider implementing these extensions to promote transparency and enhance instructional quality. The research demonstrates the need for and effectiveness of the discussed visualization extensions on the Moodle platform.
REFERENCES
- Gamage H.P.W., Ayres J.R, Behrend M.B. A Systematic Review on Trends in Using Moodle for Teaching and Learning. International Journal of STEM Education, 9, 9 (2022). https://doi.org/10.1186/s40594-021-00323-x
- Walter Vladimir Flores-Piñas, Haydee Flores-Piñas, Paulo Cesar Chiri-Saravia, Kevin Mario Laura-de la Cruz. Moodle in Distance Education. PURIQ, 4, pp.e 417 (2022). https://dx.doi.org/10.37073/puriq.4.417.
- Gabriela Carmen Oproiu. A Study about Using E-learning Platform (Moodle) in University Teaching Process. Procedia - Social and Behavioral Sciences, Volume 180, Pages 426-432, (2015), ISSN 1877-0428. https://doi.org/10.1016/j.sbspro.2015.02.140
- Official Documentation of Moodle. 2023. https://docs.moodle.org/403/en/Main_page.
- Froissard Chris, Richards Deborah, Atif Amara, Liu Danny. An Enhanced Learning Analytics Plugin for Moodle: Student Engagement and Personalised Intervention. (2015). https://opus.lib.uts.edu.au/bitstream/10453/136695/1/MEAP_ASCILITE2015.pdf
- Zhang Yaqun, Ghandour Ahmad, Shestak Viktor. Using Learning Analytics to Predict Students Performance in Moodle LMS. International Journal of Emerging Technologies in Learning (iJET), Vol. 15, No. 20 (2020). https://doi.org/10.3991/ijet.v15i20.15915
- Besiki Tabatadze, Elene Sokhadze. Possibility of Improving the Training Course’s Content Based on Statistical Analysis of the Collected Points. Globalization and Business, Vol. 8, No. 15 (2023). https://doi.org/10.35945/gb.2023.15.005
Downloads
References
Gamage H.P.W., Ayres J.R, Behrend M.B. A Systematic Review on Trends in Using Moodle for Teaching and Learning. International Journal of STEM Education, 9, 9 (2022). https://doi.org/10.1186/s40594-021-00323-x
Walter Vladimir Flores-Piñas, Haydee Flores-Piñas, Paulo Cesar Chiri-Saravia, Kevin Mario Laura-de la Cruz. Moodle in Distance Education. PURIQ, 4, pp.e 417 (2022). https://dx.doi.org/10.37073/puriq.4.417.
Gabriela Carmen Oproiu. A Study about Using E-learning Platform (Moodle) in University Teaching Process. Procedia - Social and Behavioral Sciences, Volume 180, Pages 426-432, (2015), ISSN 1877-0428. https://doi.org/10.1016/j.sbspro.2015.02.140
Official Documentation of Moodle. 2023. https://docs.moodle.org/403/en/Main_page.
Froissard Chris, Richards Deborah, Atif Amara, Liu Danny. An Enhanced Learning Analytics Plugin for Moodle: Student Engagement and Personalised Intervention. (2015). https://opus.lib.uts.edu.au/bitstream/10453/136695/1/MEAP_ASCILITE2015.pdf
Zhang Yaqun, Ghandour Ahmad, Shestak Viktor. Using Learning Analytics to Predict Students Performance in Moodle LMS. International Journal of Emerging Technologies in Learning (iJET), Vol. 15, No. 20 (2020). https://doi.org/10.3991/ijet.v15i20.15915
Besiki Tabatadze, Elene Sokhadze. Possibility of Improving the Training Course’s Content Based on Statistical Analysis of the Collected Points. Globalization and Business, Vol. 8, No. 15 (2023). https://doi.org/10.35945/gb.2023.15.005
Downloads
Published
Issue
Section
License
Copyright (c) 2023 Author

This work is licensed under a Creative Commons Attribution-ShareAlike 4.0 International License.


